Author: ST Staff

  • Bitcoin (BTC) crosses the $50K Barrier

    Bitcoin (BTC) crosses the $50K Barrier

    For the first time since the crash, Bitcoin (BTC) has crossed 50k for the first time in three months. The road till here was insanely very difficult and full of chops. The coin had dropped down to a price of 29k. BTC tried to break the range of 40k but was unable to do so and dropped down back to 29k. The impulsive move came after this point and it rallied upwards and now has reached 50k. The price is closer to its All Time High than the anticipated 20k price.

    50k is strong horizontal resistance but at the same time, it has a psychological affect as well. Being such a rounded number and symmetrical, this price possessed a barrier within itself. At the time of writing the coin is being traded above this prize, but it can retest this zone to see whether the support holds or not.

    Before this, BTC was ranging above the support of $48.6k and resistance at $49.5k. The coin showed a pullback from this zone and it was thought that it might drop to $47k and a lot of shorts were triggered at this point, but it stopped at $48.0k. As a result, a lot of positions have been liquidated because of this.

    What happens now?

    Currently, the market has a divided opinion on the movement. Some are quite sure that the Btc will cross $55k while some are saying that we are due for a correction, otherwise we will see a massive retracement at the upper resistance zone.

    Crossing this particular zone, a lot of people have entered the market once again. Different positions have sprung up that are aiming for the late 50 zone. Nevertheless, BTC has showed remarkable movement. As of now, the total market cap of the crypto market has crossed $2T. Currently, the BTC dominance is 44.44% in the total market. Meaning that it still holds the major dominance in the market.

    Long term Estimations

    Enthusiasts call for the price of $100k at the end of the year. As it moves up with its dominance still at one point, we can expect alts to run as well. On the other hand, bears are also present who are still calling for $20k BTC. Normally when the weekends print red, this week has been really good as many coins went up. $Luna, $Sol $Ada $eco went on to create an all-time high.

  • Trading 101: How confirmations are used during Trading

    Trading 101: How confirmations are used during Trading

    Confirmations are known as additional confluence when you are trading. It is important to note and know about confirmations during looking for entry setups. It helps to get a good entry point during a trade.

    Trading Styles and Confirmations

    Many different traders use different trading styles to find entry setups. Somme use VSA, some use s and r some use Wyckoff, Elliott waves, and many more. But all of these traders look for potential additional confirmations before executing their trades. One of these methods is to look at the lower time frame

    Lower Time Frame Confirmations

    One way of getting confirmations about trend change or about the fact that whether the market is going to bounce or retrace from a certain point is to look at lower time frames.

    Suppose a coin is dropping and moving down after touching the upper resistance. Now that asset is on support. Normally people long from this point but a very good idea is to look at LTF to understand whether the market is actually bouncing or not.

    If you are on Hourly Time Frame and you see an asset touching support, go to lower time frames, you would see that the market might bounce from that zone. But should you take a trade at this point? No, because this might be a deviation. Wait for the market to touch the support again (LTF). If the continuation is going to happen it might wick down and touch the zone and then retrace back to being bullish again. This here can be your trigger point to execute your trade.

    Illustrated below is an example how we can use this.

    Figure1.Tel 4H TF Chart
    Figure1.Tel 4H TF Chart

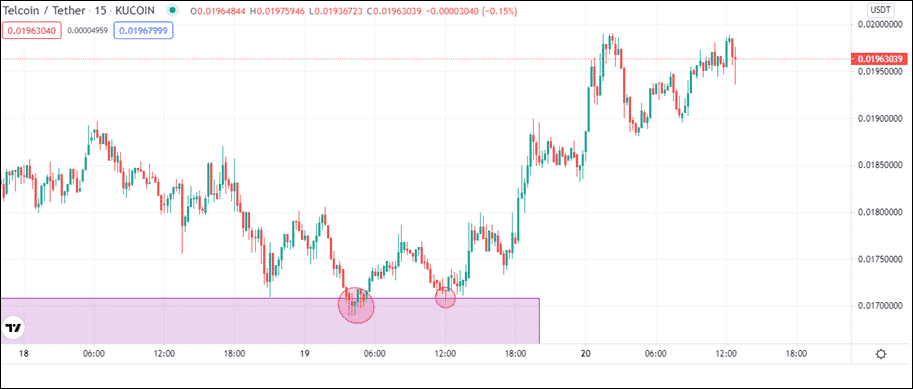
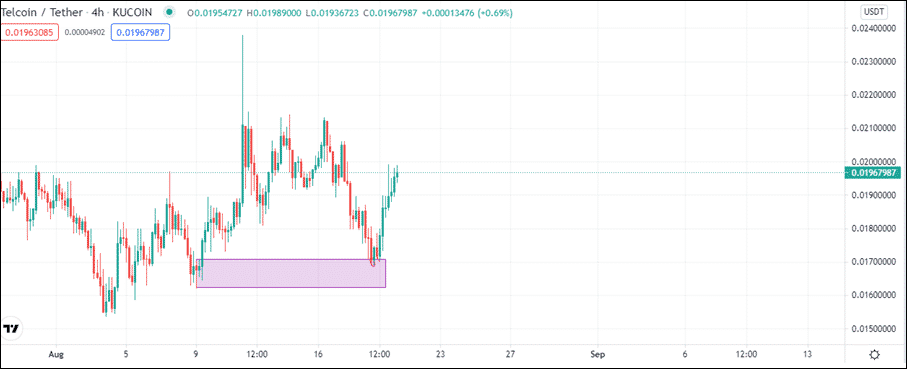
    A chart about $Tel on 4H TF, notice the zone and the formation of order blocks. You might take a trade during the touching of this zone, but we would look at LTFs, say 15 min to look at additional confirmation.

    Figure2.Tel 4H TF Chart
    Figure2.Tel 4H TF Chart

    Look closely at the 15 min chart. The price wicked down the first time and then bounced back. But a better way is to wait for the market to come back and test the support zone again. As you can see in the chart, the price did come down and touched the zone again, with a small wick. That can be a trigger point for you to go long.

    In short additional confirmations helps you make better decisions regarding how the price may move.

  • Polkadot (DOT) Coin – Is the momentum still there?

    Polkadot (DOT) Coin – Is the momentum still there?

    Polkadot (DOT) coin being ranked at #9 on coinmarketcap is a famous currency having an enormous volume of $2,242,092,966 currently. Gavin Wood is the original author of this token with its first token sale on October 27, 2017, raising 400,000+ ETH. Dot has been listed on every top crypto trading platform.

    The purpose is to seek to incentivize a network, a blockchain giving its users an opportunity through which they can launch and operate their own blockchains.

    DOT coin works on Binance smart chain. Currently, the market is being traded on $26.59 with a rise of 10% in the last 24Hr.

    Technical Analysis

    Being one of the famous currencies, many traders want to get involved in this but is it the correct time right now? Let’s jump into that:

    Polkadot has been in a bullish trend for a very long time till 14 May 2021.

    DOT coin as usual faced heavy bearish pressure because of a decrease in Bitcoin Value. Dot afterwards has been making Lower Lows and Lower Highs forming a bearish trend.

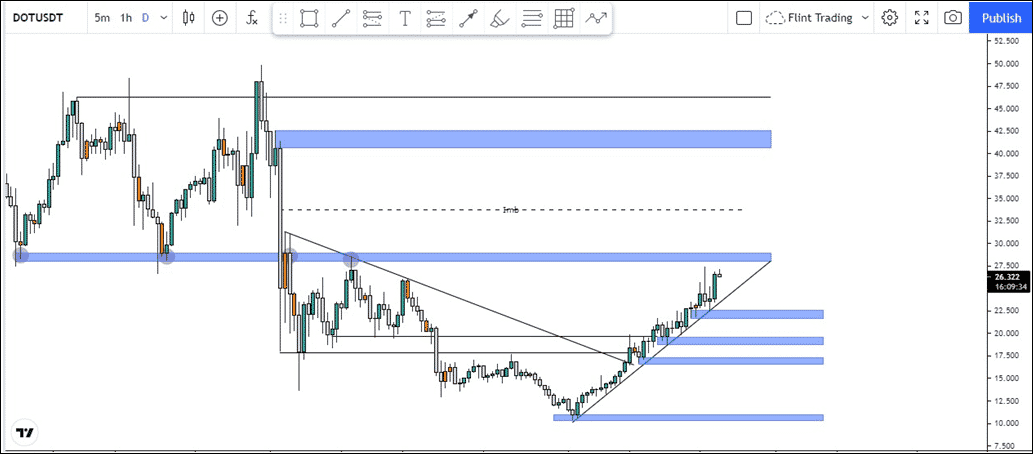
    Recently on 22 July, DOT coin has actually started to gain bullish momentum and it seems that buyers are more likely to be interested in the market. In a period of only 30 days, the coin has rose from $9.778 to $26.416 which is almost 300% growth.

    Technical Analysis
    Technical Analysis

    Now the market has broken $19.766 and $17.768 levels recently quite easily which were strong resistances. It shows that the control of the market has been towards the buyers atm.

    Moreover, the trend line which was being respected for few weeks has been broken as well. Now the important thing to consider is, even with all these, unless and until the structure haven’t broken, the market can’t be considered in a uptrend which it had as well putting the market in an uptrend which took place on 19 august 2021.

    Nearest Support and Resistance Levels

    The market is approaching a zone of resistance ranging from 29.027 to 27.938. This zone has been reacted several times in the past and a reaction can be expected from this desired zone. Talking about the nearest supports, the levels of 22.308 19.221 16.770 are worth watching, because in case of a pullback of this impulsive move, the market in most certain situations can reverse from any of these areas.

    And in case if the zone of 27-29 doesn’t hold, there seems no reason for DOT coin price to fall until 40.559 as it comes above imbalance which market may needs to fill and moreover the zone is a supply one, so possibly a reaction might be noticed from that.

  • Hot under $1 stocks to look out for in the coming months

    At the moment, the pandemic and the effects of the Delta variant are the most important factors impacting penny stocks and blue chips. This has led to new cases popping up around the world, causing people to fear that the pandemic is far from over.

    A high level of uncertainty and increased volatility have resulted from these fears. In recent weeks, the blue-chip stock market has largely been flat, but certain under $1 stocks have performed well. Since penny stocks tend not to adhere to the rules, finding decent gains on an intraday basis is relatively easy.

    Many view penny stocks as speculative investments due to their volatile trade trend. Investors purchase penny stocks in an attempt to capitalize on an eventual change in stock market trend.

    As penny stocks are unpredictable, investing in them always can cost a lot of money. To avoid unpleasant situations it is essential to understand how penny stocks fluctuate.

    Research on relevant investments helps investors make informed decisions. By learning their metrics, fundamentals, and developments, penny stocks can be as profitable as any of the Fortune 500 companies.

    Salarius Pharmaceuticals (SLRX)

    The first stock we’d like to consider is Salarius Pharmaceuticals (NASDAQ: SLRX). In recent years, biotech has gained significant attention in the market. There is no doubt that vaccine stocks have played a significant role. However, immunotherapy firms are rapidly catching up. Cancer treatments are among the company’s specialties. In clinical trials, the company is evaluating how well seclidemstat treatment can treat Ewing sarcoma or hematologic cancer.

    The FDA has also granted seclidemstat designation as a Fast Track drug, an Orphan Drug, and a Rare Pediatric Disease.

    Keep in mind that the company is doing a lot lately. Recently, Marcus attended Diamond Equity Research’s Emerging Growth Invitational Conference. An overview of the company’s activities was presented by CEO David Arthur, who pointed out recent achievements in clinical research. SLRX stock has seen a slight increase in trading activity since that presentation.

    Gold Resource Corporation (GORO)

    Another under $1 stock worth checking out is Gold Resource Corporation (GORO). GORO had a bad start to the year. During the past 12 months, its value has plummeted by 55%, a shocking drop. After glancing at the company’s recent results and conference call transcripts, There wasn’t particularly excitement about the stock either. I did, however, find the takeaways to be quite positive, despite my reservation.

    Thus, Gold Resource seems to have overcome one of its recent challenges, though silver production may not reach management’s original estimate for 2021 until as late as next year. It was particularly refreshing to hear the management’s honesty and integrity on the call.

    Allen Palmiere told the investors about Gold Resource’s struggles this year and why he believes the company can create shareholder value.

    The stock has risen 7% over the past few days, so the market seems to have liked the second-quarter results and call. This isn’t a huge improvement, but it might be a start. A turning point in the stock’s performance is possible. So, be on the lookout for this one.

  • How Greed and Fear affects the Trading and Markets

    How Greed and Fear affects the Trading and Markets

    In trading and investing, greed and fear are the two faces of the same coin. Whether you are trading crypto, forex, options, or stocks, these two ideas have an influence on you and they change their decisions. Both of these have resulted in a lot of losses for people.

    Greed and Longing the top

    When the market is bullish and printing green candles, people tend to become greedy. During those times they invest more and more in hope of huge returns from their investments. Greed overtakes them; they don’t take profits from their positions because according to them they will miss out on the run. Market sentiments play an important part in trading. Big traders and successful people take caution during these times. It has been previously seen that during extreme bull runs market shifts their structure and a lot of people get liquidated at the top. “Don’t Long the top” is something you should get in your mind. People get FOMO; they think that they are going to miss it. But once they enter it, the market is already at the top and now is due for a correction.

    Dips are a gift, buy them

    Similarly when the market is bearish and cryptos are bleeding, fear overtakes people. During these times, the first priority of these people is to preserve their capital. This is why when fear takes over the general audience and investors; they get out of the market as soon as they can. Even when suffering losses, they take their money out because they think that the current market conditions are far worse and the more they stay the more losses they are going to suffer. Potentially professionals consider these as buying opportunities and invest during the dips. FUDS propagate fear in the market. Professionals who know the true nature of FUDs buy the dips that have resulted because of the fake news.

    Greed and Fear Index

    Greed and fear Index has been created, although it doesn’t give you accurate results, it does give you a general sentiment of the market. Social media talks, dominance, volatility, volume/momentum, dominance, and trends, all of these things can be taken into account to get an idea about the current market conditions.

    As a trader learning to control our greed and fear is important. Taking profits is an essential part of becoming successful. Similarly controlling fear is also important. Selling your assets in red isn’t a good idea most of the times.

  • Vitalik Buterin joins Doge Foundation along with Elon Musk’s advisor

    Vitalik Buterin joins Doge Foundation along with Elon Musk’s advisor

    The coin started as a meme back in the days and now it has created many multi-millionaires. Dogecoin, the internet sensation that probably has resulted in increased exposure of the crypto market, is now lagging behind. Where coins such as $sol and $luna have went on to create ALL Time High through a staggering performance, Elon’s favorite meme coin is lagging in the market.

    At one point due to the internet of course “DogeFather” (commonly known as Elon Musk) was an avid follower and preacher of the so-called next-generation coin. During those times huge money got poured and the coin became one of the biggest cryptocurrencies in the market.

    Of course, when the market officially starts a downtrend, it sweeps everything with it. So following the trend doge also went down. According to coinmarketcap the coin had established $0.739775 on 8th may, 2021 before falling to its demise. After the reversal on 21st July, the coin showed a sign of going up again. Currently, Dogecoin is being traded at a price of $0.30.

    Dogecoin Foundation

    No doubt Elon Musk holds a strong influence on Dogecoin. He in the past has said that he wants to bring changes to the cryptocurrency and would love to use it in the future. Recently the news has been released about the board members. It’s huge news that the founder of Ethereum has joined the board along with the founder of Dogecoin himself. Other notable people include Jared Birchall as the financial advisor (he also looks over Elon Musk’s family office).

    DOGE Coin Technical Analysis

    After the news about the new members were released, the price surged, but the pump couldn’t survive and soon got down since $Btc broke its support and started trading at less than $45k.

    On a 4H TF, the market becomes quite visible. Pole and flag formation can be in the chart. Pole has formed and the flag is currently being formed. This shows that the price may drop to a certain level before its continuation. $0.286 and $0.277 are the intermediary zones where the price can bounce off, but reversal signs should be taken into consideration. If both of these fail to hold then we can expect a drop to around $0.26. A falling broadening wedge is also forming on the 4H time frame, a pattern with a higher probability of breaking to upside. In the bullish scenario, the nearest lower low is at around $0.33, breaking it would confirm the reversal sign IF the market doesn’t drop (if it drops then there would be a formation of a new LL and LH).

    With such good news regarding the community, doge foundation is back again to bring new heights.

  • Fetch.AI (FET) – Will it Rally again?

    Fetch.AI (FET) – Will it Rally again?

    Fetch.AI abbreviated as FET is a token released by a Cambridge based artificial intelligence lab, which bring the AI based machines economy to life utilizing different algorithms. It started in 2017 while the mainnet was released in December 2019.

    The purpose of this token is to be used as the value on Fetch.Al network. It is based on Ethereum blockchain.

    The coin has been popular among trading communities. FET has been listed on all major platforms listing such as Binance, Kucoin, crypto.com, etc.

    At the time of writing, according to coinmarketcap,  FET is being traded at the rate of $0.518 with a decrease of 0.80% in the last 24 hours according to statistics. Besides, it has been recorded that trading volume has decreased with almost 11.80% leaving the total volume at $39,245,274.

    FET is being considered as an awesome long-term investment ranging from 1 year to several according to crypto enthusiasts. With a 5-year investment plan, the revenue is expected to touch +280%.

    FET Technical Analysis

    FET reached its all-time high on 31 March 2021 reaching a value of $0.87871, from where a drop has been noticed all the way down to $0.15937. In these recent three months from 31 March 2021 to 22 June 2021, the market has been in a bearish trend by following the structures of Lower lows and Lower highs.

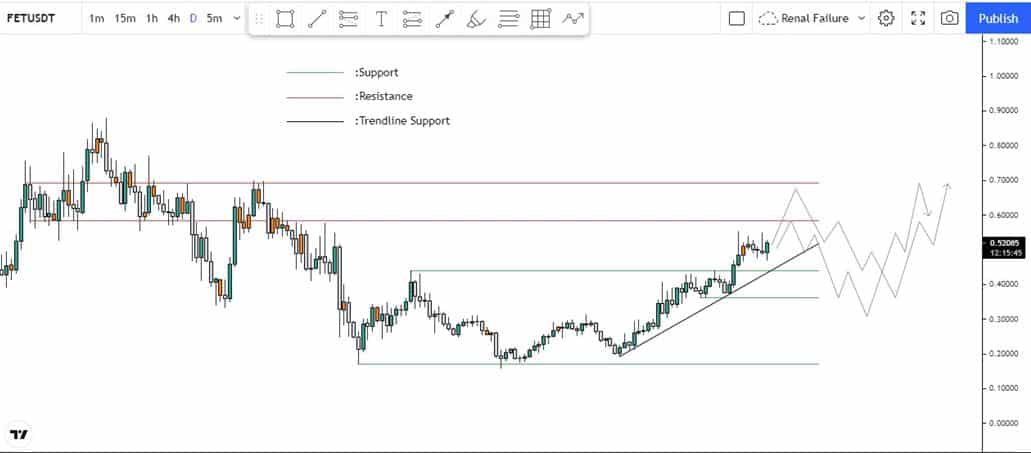
    Almost all the coins had been consolidating in a range from 23 may to 9 August and afterwards the market had broken the consolidation putting us in a new trend. The level of $0.43726 was the structural point which got broken, so it can be expected that the market has shifted from a bearish to a bullish trend.

    Current Support and Resistance

    The nearest resistances are $0.58598 and $0.68985 from where the market can show a pull back before continuing upwards following the wave patterns.

    Current Support and Resistance
    Current Support and Resistance

    Talking about the nearest supports, the levels of $0.43962 and $0.35935 are worth watching and can be considered as the points from where the pullbacks might get over as they are in line with fibo levels of 0.50 and 0.618. Supports can be used to enter longs.

    Summarizing it, the market is in a bullish trend at the moment, and buyers are in control, although the market has progressed rapidly to the upside, a pullback should be expected for it to breathe in order for it to rally more upside. Entries can be looked at by having additional confirmations.

  • LM Funding America, Inc. (LMFA) Stock Gaining Heavily Today, Here’s Why

    LM Funding America, Inc. (LMFA), a specialty finance company, has surged a massive 9.33% in the current market after the company reported tremendous quarterly results for three and six month period of the fiscal year 2021 on Monday. As a result, LMFAstock currently stands at $5.03.

    Quarterly and six month results

    According to the reported results, the total net income of LMFA for three and six-month periods ended on 30th June stands at $11.1 million. The amount of cash increased to $22.2 million. Also, as of 6th August, the common shares outstanding were 5,414,296. LM Funding also said that during the first six months of 2021, it developed a digital asset security strategy to increase its business, and also, sponsored a special acquisition company, and closed a $103.5 million upsized IPO.

    Acquisition of LMFA common stock

    On 30th July, Custodian Ventures LLC, an investment fund, filed a Schedule 13D and announced that it was acquiring some 5.2% common stock outstanding of LM Funding. David E. Lazar, Chief Executive Officer of Custodian Ventures, said on the occasion that Custodian Ventures LLC invested in LMFA due to the Company’s stated intention to explore potential acquisitions, financing activities, and strategic transactions to maximize shareholder value.

    LMFA Q1 financial results

    In mid of May, LM Funding announced the quarterly results for the first quarter of the fiscal year 2021, which ended 31st March. According to those, the revenue generated during the quarter, the company generated revenue of $177,000, as compared to revenue of $341,000 during the equivalent period of 2020. The operating loss during the quarter stood at $1,728,000, as compared to an operating loss of $561,000 during the equivalent period of 2020. The net income during the quarter stood at $4.4 million, while the cash increased to $17.8 million, while it stood at $11.5 million on 31st of December 2020.

    Reverse stock split

    In early May, LM Funding America, Inc. (LMFA) announced a 1-for-5 reverse stock split of its outstanding common stock. During the annual shareholder meeting, the company decided to make amendments in the company’s certificate of incorporation. Afterward, the board of directors approved a 1-for-5 reverse split. Bruce M. Rodgers, Chairman, and CEO of LM Funding said on the occasion that the reverse stock split would make available an increased number of authorized but unissued shares to pursue potential acquisitions and additional financing activities.

    Agreement with Borqs Technologies

    In February, LM Funding announced to have entered into a master loan receivable Purchase and Assignment agreement with Borqs Technologies. Under the agreement, LMFA agreed to purchase about $18 million of loan receivables of Borqs Technologies. LM Funding completed its obligations to purchase $18.2 million of debt during a period from 7th January to 10th February 2021.

    Replacement of director

    In January, LM Funding announced to incorporate Frank Silcox as a member in the Board of directors in the place of Martin Traber, who resigned from the board. Silcox, who originally founded the company, returned back as an independent director. Also, he served as Manager of LMFA’s subsidiary LM Funding LLC.

    Future of LMFA stock

    LMFA stock seems to be on a rising curve in near future, based upon recent market performances and analysts’ estimates. This is evident from the fact that EPS for this year could grow by some 49.10%. The short-term investment could create issues due to market volatility, but long-term investment in LMFA stock could yield a positive outcome. So, potential investors should keep a close watch on LMFA stock.

  • Arcimoto Inc. (FUV) Stock Declining in Pre-Market, Here’s Why

    Arcimoto Inc. (FUV), a manufacturer and seller of Electric vehicles in the US, is experiencing a loss in premarket, hours after the company announced quarterly results for the second quarter. At the time of writing, the Arcimoto Stock stands at $12.10, a decrease of some 13.63%.

    FUV Stock Q2 financial results

    According to the quarterly results for the second quarter of the fiscal year 2021, which ended 30th June, the company manufactured 74 Electric vehicles, and besides, sold 1 pre-owned and30 new customer vehicles. Also, during the quarter, Arcimoto had a demonstration of a driverless fun utility vehicle, which is a first of its kind. That was done using remote control technology. According to the financial results for the quarter, the total revenue generated during the quarter stands at $717,000, which is an increase of 167% when compared with the revenue for an equivalent period of 2020. FUV stock faced a massive net loss of $8.2 million (about $0.23 per share) as compared to the equivalent time of the previous year when net loss stood at $3.7 million (or $0.15 per share). The company also said that it has total assets of $86.5 million while having a debt of $3.9 million.

    Investigations against Acrimoto

    On the 7th of August, the Barger Eagle & Squire P.C., a recognized law firm, started investigating the directors and officers of Arcimoto Inc. The investigation began after the filing of a class action complaint against Arcimoto. The complaint alleges that officers of Arcimoto made misleading statements about the fabrication in preorders of Fun Utility Vehicles Also, Arcimoto was accused that it failed to disclose to its customers that all of its vehicles were delivered to the customers were under a safety recall. Also, Arcimot o’s partnership with HULA was an undisclosed related property transaction.

    FUV Stock Reported Partnership with Redivivus

    In late July, FUV stock announced to have entered into a partnership with Redivivus, a lithium-ion battery recycling company. The partnership revolves around a battery recycling program. The agreement would result in Redivivus providing batter processing solutions to the Acrimoto manufacturing plants and service centers. The partnership aims to adopt more environmentally friendly ways to manufacture new technologies, as compared to the other battery recycling technologies. Redivivus Founder and Officer Erika Guerrero said on the occasion that the partnership between both of the companies would solidify the relationship between Acrimoto’s founders and the battery industry.

    Pilot project with Tennessee clean fuels

    In July, FUV stock announced to have entered into a pilot project with Tennessee Clean Fuels and Drive Electric Tennessee to test the Fun Utility Vehicles across the state. During that 30 day program, which had to begin on the 16th of August, all the major cities would test Acrimoto’s vehicles. Jonathan Overly, Executive Director for the East Tennessee Clean Fuels Coalition said on the occasion that he hopes that pilot will serve as a meaningful step in making electric transportation more efficient and accessible, while improving public health, equity, and access.

    What lies ahead?

    From statistics, it seems that Acrimotohas a bright future ahead. The revenue estimates suggest that during the next year, the company could generate revenue of $41.45 million, while the company EPS is expected to grow some 30.60% during next year. These statistics should compel potential investors to keenly look at the future performance of FUV stock.

  • Polygon Coin – Will the MATIC rally again?

    Polygon Coin – Will the MATIC rally again?

    Polygon (MATIC) was founded in October 2017 by Kanani, Sandeep, and Anurag Arjun. It is considered in top coins on coinmarketcap with a ranking of 16.

    MATIC is based on Ethereum protocol and was founded for the purpose to “create, issue and manage digital securities and vulnerabilities on the blockchain”. It is being traded at the rate of $1.49 currently with a change of plus 5.10% in the last 24 hours. Polygon is one of the most promising coins currently in the market.

    Trading volume has increased by 27% in the last 24hours making the total volume $1,133,995,290.34.

    Polygon Technical Analysis

    Looking at the past, it can be clearly observed that Polygon (MATIC) is showing a correlated movement as of Bitcoin. Besides the BTC influence, what else can be looked at?

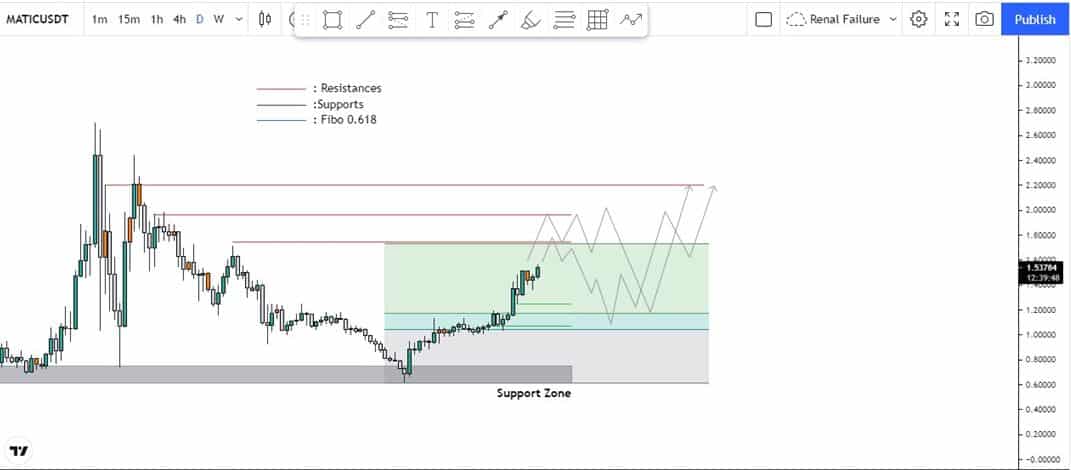
    The market has been making Lower Lows and Lower Highs from 20 May 2021 i.e. $2.71637 (all-time high) to 21 July 2021 i.e. $0.6046. Recently as the market touched and mitigated the low which was created on 23 May 2021, Polygon has rallied up with huge momentum. In this recent situation mass psychology has played quite a big role. These 2 moves down to 0.7355$ had triggered buyers to get in as they are seeing price is rejecting from that zone and it can be considered as the double bottom on a bigger scale.

    Polygon Technical Analysis
    Polygon Technical Analysis

    The market has broken the previous structure which was at $1.47715, moreover, the MACD is showing an increase in momentum, giving a sign of strong push, but the pullback can’t be ignored even with all these confluences. The market might pullback from $1.734 and continue downwards to Fibo level 0.618 which is at $1.04662 before going up.

    All this is for the technical side but BTC plays an important role in this pair movement so it shouldn’t be ignored. Probably the first and most important confluence should be BTC and how it is behaving. Recent supports and resistances can be seen in the chart. Entries should always be taken with caution and with additional confluences, like RSI, MACD, or trend line.

    Is the rising wedge a Bearish sign?

    It can be seen that Polygon (MATIC) is forming a rising wedge that normally is a sign of a bearish prediction but in a strong trend and markets, these often fail but should never be ruled out of the question. Whatever the situation, play with the levels.