Tag: GRT

  • The Graph (GRT) – What is the Chart Showing?

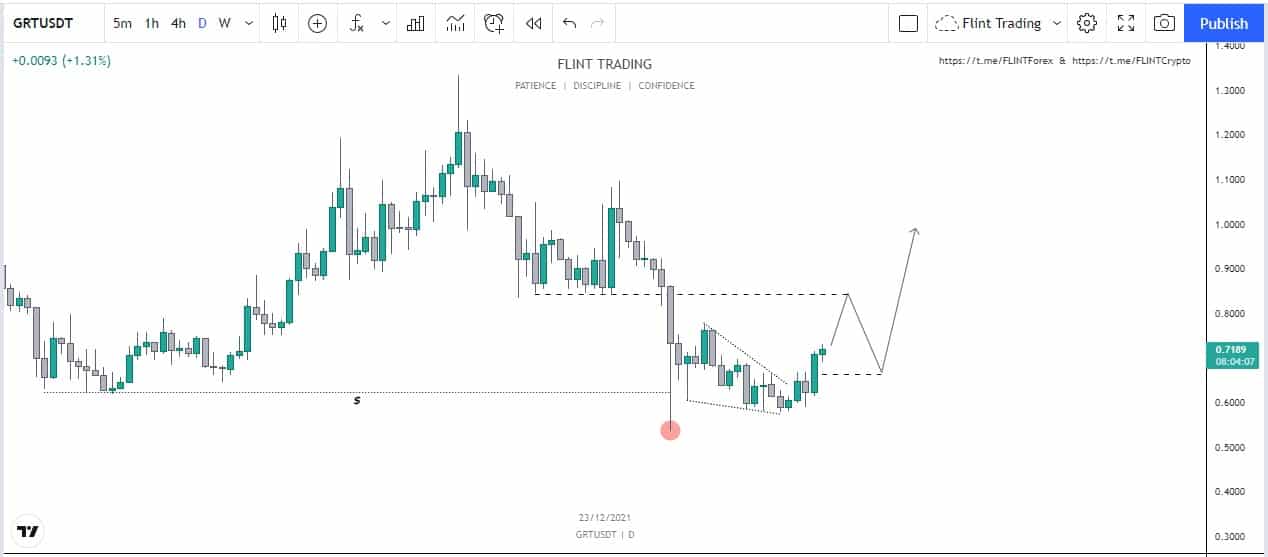
    So having a look at GRTUSDT, and checking the price action from the weekly time frame, the price seems very bearish structure-wise at the moment. Having a look at full and macrostructure on weekly is really not too important as 4H is the entry Time Frame, and targets and invalidation points are accordingly. But it’s important to check out the weekly levels and past weekly candles. Talking about the previous Low which was around $0.4306, the price recently stop hunted that. This has allowed the price to grab necessary liquidity which serves as fuel for the price to move in any direction. Now as it has grabbed, the price has the potential to move in the upward direction to make its Lower High. Talking about the candlestick anatomy, the previous week closed at bearish while the one before the previous was bullish. This week seems bullish as well, and if it does close as a bullish, this would be a double bottom on a lower time frame, and it shows bullish intentions.

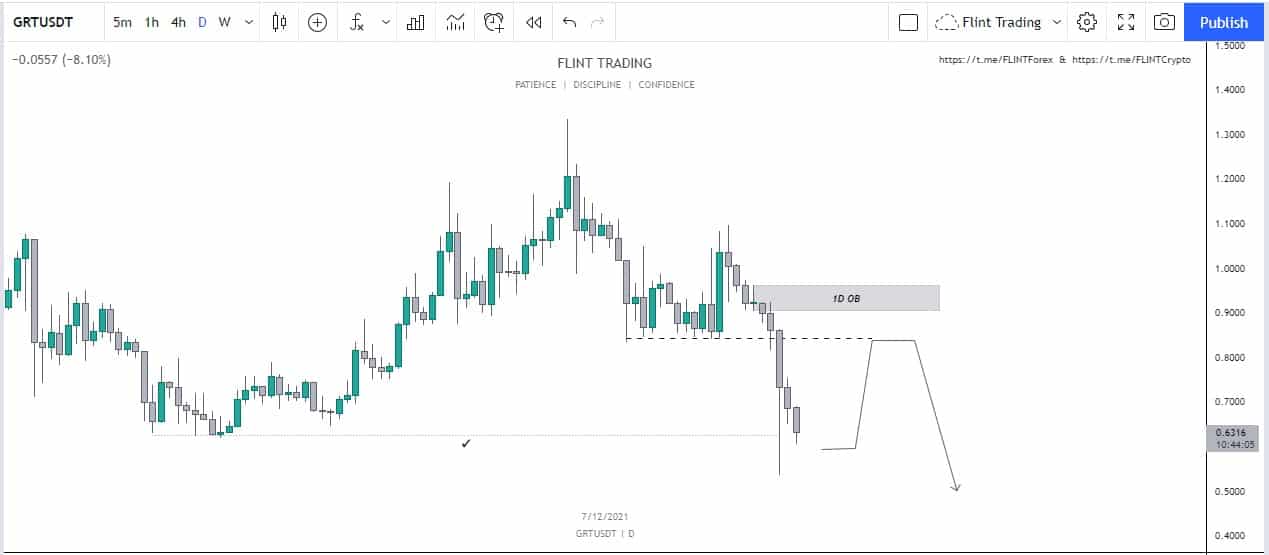
    Moving down to the Daily Time Frame, GRT has some confluences for the upward movement as well, the price has clearly shifted structures to the topside, and the move down afterward was probably a process of mitigation. Now if momentum is observed, the way price came for mitigation and the way price bounced after mitigation shows a lot. There is a much difference in both of the momentum, and it clearly shows that buyers’ momentum is strong and they are interested.

    GRT - 4H

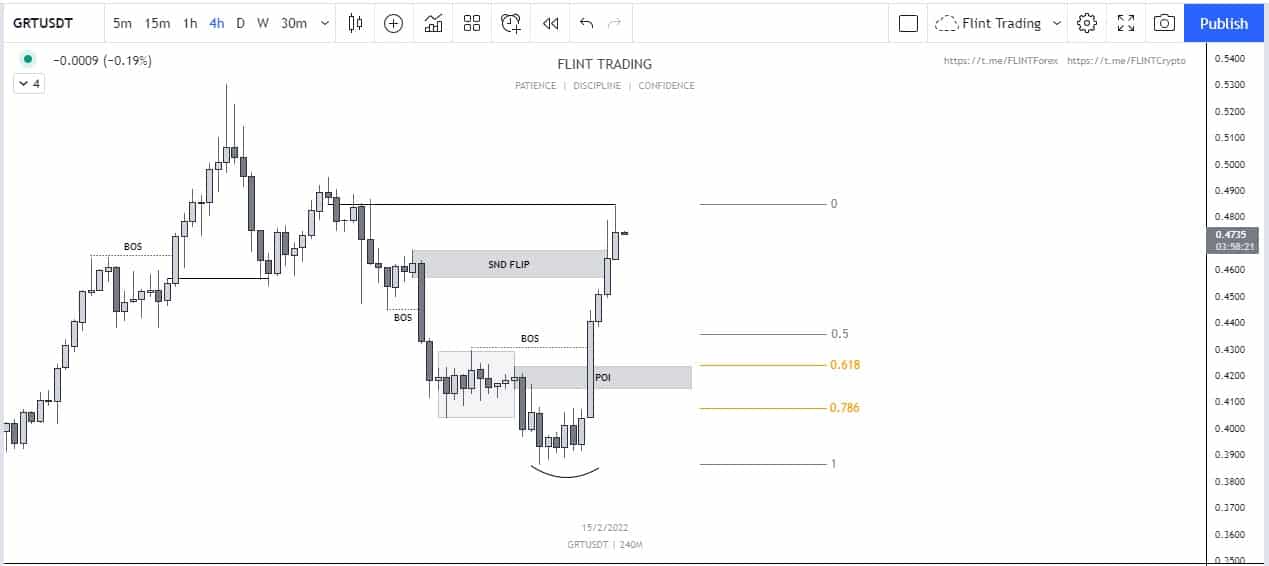
    Moving to the last time frame which is the 4 Hour time frame, GRT has shown some beautiful Price action. First thing, talking about the structure, it’s clearly broke to the upside in 4 Hours. The price when was pushing down started consolidating at one point which defiantly was a trap for buyers. It took out the early buyers by another push to the downside and once it goes the necessary liquidity, it bounced significantly to the topside. Supply was failed by the demand, and demand is in control. Moreover, the momentum is strong so it’s always ideal to go with the momentum. Now as the momentum is strong, it’s very less likely that it will visit the extremes again for some time unless BTC messes up, being the reason The breaker Block is a good POI as it aligns with Fibo Golden ratios as well as the Equilibrium of the previous consolidation. The invalidation point can be considered around $0.3888 while the target can be considered as $0.4958

  • The Graph (GRT) – On its way to $1?

    The native token of The Graph Ecosystem is GRT

    At the time of writing, GRT is being traded at the rate of $0.7219 with an increase of almost 10% within the last 24 hours.

    The low within this tenure was around $0.6592 and the high was approximately $0.7302. The coin as being in the watchlist of many traders makes it rank all the way up to number 47th according to the latest data released by coin market cap.

    GRT during the month of February approached a near All-time High around the price of $2.8807. The trading volume today on the other hand has increased by almost 33.62%.

    The top exchanges for trading GRT are currently Binance, OKEx, FTX

    Technical Analysis –  The Graph (GRT)

    GRT has been dropping hard for a long time. For a long time, the price of GRT has shown reversal and started to a dropdown. This happened when the price failed to hold the level and couldn’t create a new higher high. The price dropped down and went into consolidation for a few days.

    The price of GRT did print a green candle but wasn’t enough to create a reversal in the price and soon the trend continued towards the downside. This is an important part of the price now.

    GRT - 1D

    After this, the price went down and grabbed liquidity present below before doing a descending correction. Now what we can expect from the price is that it can go up and mitigate the equilibrium position. From there we can look for lower time confirmations and additional confirmations to know how it can react. Overall, the price action of GRT is now bullish and we can be pretty sure that the structure has reversed.

    If the price drops down we can expect another leg upwards which would eventually take the price to the consolidation range. From there, we can expect another reaction to the price. If it becomes stable over that point, we can look for another higher high, otherwise, the price can drop down to the level below.

    Price Prediction – The Graph (GRT)

    GRT has been one of the slow gainers in the market. The price is still way low as compared to the all-time high.  According to wallet investor, the price of GRT is to reach a value of $0.333 in a year. This means that according to wallet investors GRT is a bad investment.

  • The Graph (GRT) loses almost 10% today – What Now?

    At the time of writing, GRT is being traded at the rate of $0.64 with a decrease of almost 10% within the last 24 hours.

    The low within this tenure was around $0.6064 and the high was approximately $0.7223. The coin as being in the watchlist of many traders makes it rank all the way up to number 48th according to the latest data released by coin market cap.

    GRT made its all-time high in the month of February 2021 where it reached an enormous amount of $2.887. It later fell down to a price of $0.428 during the crash from where it showed reversal. At the moment it has a daily volume of $154,931,269 with an increase of 14.41% within the last 24 hours. The circulating supply of GRT is now around 4.72B and the maximum supply is 10B. GRT has a dominance of 0.13%.

    The top exchanges for trading GRT are currently OKEx, Huobi, Binance, FTX.

    Technical Analysis – The Graph (GRT)

    On the daily time frame, we can see that the price has been bearish now and is now at a really important level. Failure to hold this level would trigger the price to drop down even further.

    The wick two days before had grabbed the liquidity below the level but it looks like that it would need strong momentum for GRT to show a reversal at this point.

    GRT -1D

    In case of the price rallies upwards, we can expect a rejection from $0.82. From there we can look for two different scenarios depending on how the price unfolds.

    In short, good risk management is necessary for a market like this. For the next few days, the price of Bitcoin may consolidate and we can expect a few altcoins to pop. If GRT manages to hold above the level, we can expect the price to rally up soon.

    Price Prediction – The Graph

    In the long run, GRT is not considered a good investment. The price is currently at the same level where it was in July and has completely retraced back.  According to the wallet investor, the price of GRT is to reach a value of $0.314 in a year.

  • What is The Graph (GRT) and why is it bullish?

    Towards the beginning of July, The Graph (GRT) picked up the pace and turned the market sentiment bullish. GRT crypto had been struggling with bearish momentum ever since April but the trend appears to have been reversed now. At the time of writing, GRT stands at a price level of $0.68. The cryptocurrency has grown by 27% in the past week and the growth continues in the shorter timeframes as well.

    What is The Graph (GRT)?

    The Graph (GRT) is used to collect, process, and store data from blockchain applications. It is an indexing protocol which means the network indices the data collected into various subgraphs which makes retravel easy. Applications can send queries to the network and retrieve relevant data easily.

    The platform has been garnering increasing attention. Data is the future of the world and The Graph provides data in a form where it can be used efficiently by dApp developers for insights and improvements. Users are categorized into indexers, curators, and delegators on the network based on their roles. The native token of the platform, GRT, is utilized to ensure the integrity of data. Users must stake GRT in order to perform their roles and earn fees.

    Why is The Graph (GRT) bullish?

    The Graph had been integrated by various projects given its unique offering of data usage. Kyber – a liquidity protocol – has announced plans of creating a data analytics page in order to use user data for efficient liquidity provision. The Kyber DMM is using a subgraph from The Graph for this purpose. This is just one of the examples of using The Graph for a better user experience.

    A strategic partnership between The Graph and Optimism had also been announced recently. The partnership will allow dApp developers on Optimistic Ethereum to create subgraphs on The Graph. This will boost the scaling of Ethereum. The Graph had also been adding support for other scaling solutions for Ethereum like Polygon (MATIC).

    The network has had high level of activity with various partnerships and integrations. This has resulted in a bullish market outlook for The Graph. The bullish momentum of the market is expected to continue as it becomes even more relevant to the blockchain ecosystem.