Tag: KCS

  • KCS- What is the chart showing us?

    KCS- What is the chart showing us?

    KCS is the KuCoin native Token that serves as a profit-sharing token that allows traders to draw value from the exchange. Just like BNB is the native token of Binance, KCS has the same potential and it’s a very good investment for the long term.

    Fundamental-wise, no doubt it’s strong, but it is a good time to purchase and hold them? Technical is the answer to knowing that.

    Starting from the Monthly Time Frame, the price initially was in the Premium range, but it went in discount and rejected beautifully off the Order Block. Now this Rejection shows very much of Bullish intentions but this is a huge wick. The concept of wick fill applies here and probably the price may retrace back down, maybe mitigate 50% of the wick and then continue up.

    Moving down to the Weekly Time Frame, it can be observed that the bearish momentum is still in control regardless of the bullish entry. Moreover, the price is still breaking structures to the downside making lower lows and lower highs showing the order flow is bearish. The previous week closed as bearish which shows bears at the end of the week were still dominant over bulls.

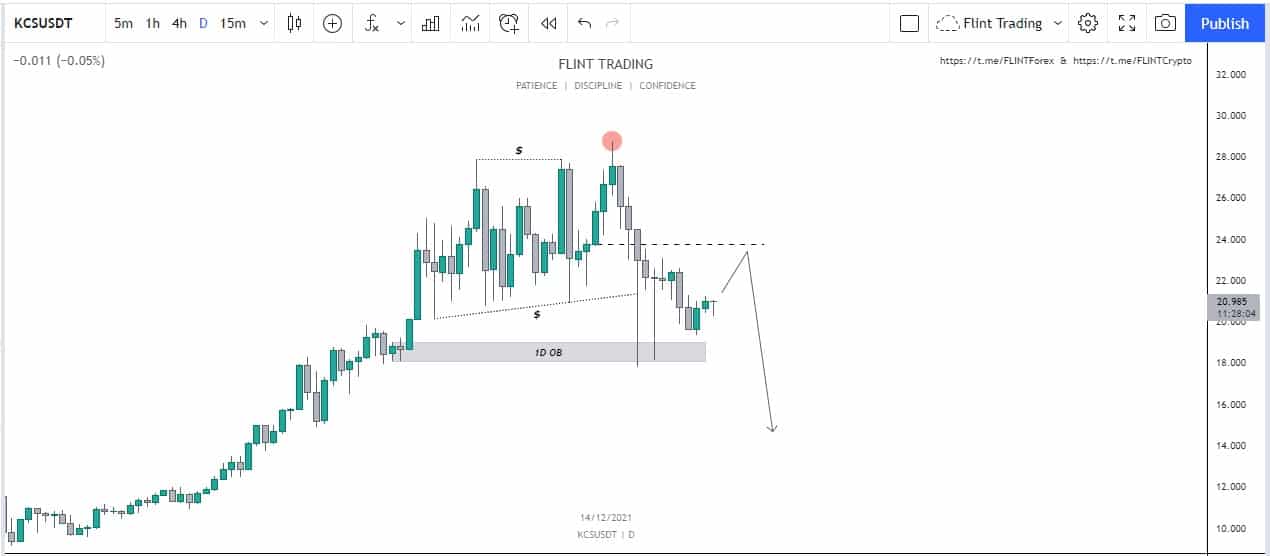
    Moving lower to the Daily Time Frame. It can be seen that price is most likely printing an inverted Head & Shoulder pattern which for the majority is a reversal pattern i.e. bullish move in this case, But as institutions tend to do the opposite of the majority so there is a pretty chance that price may continue down with the same momentum. Furthermore, the price recently is being traded with a Daily Order Block which may very possibly give more induction of sellers in the market.

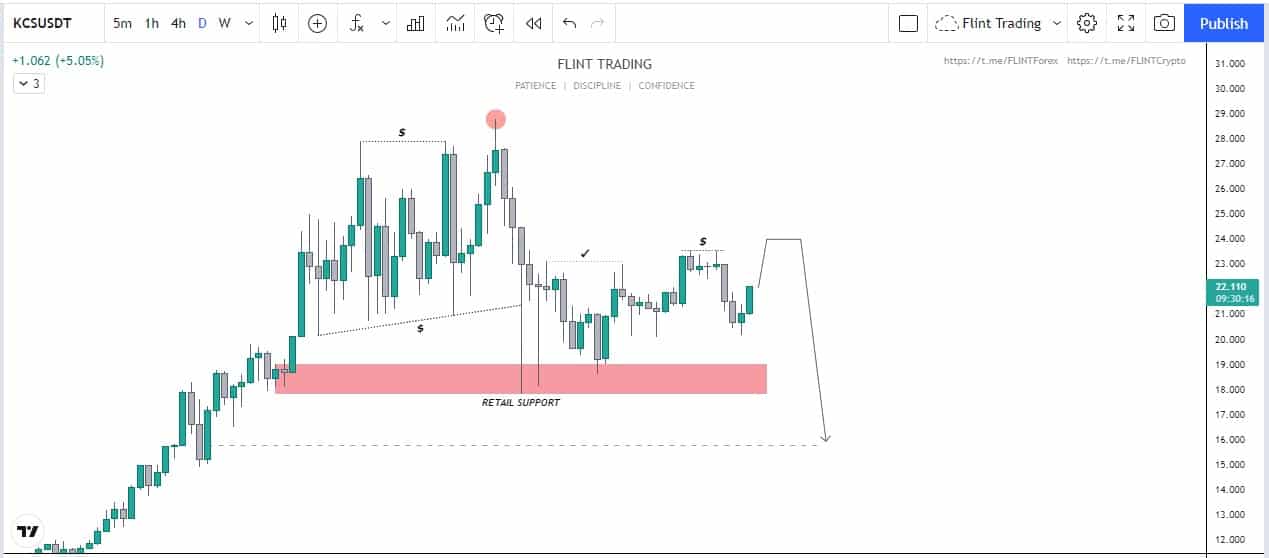
    Moving down to the 4 Hour Time Frame, it can be observed that price as soon as it was reaching the Order Block was continuously losing its momentum. As soon it tapped within the order Block, a very nice push from bears was observed which is favorable for short setups.

    Moving to the Last Time Frame, a very change in structure is observed. The last Demand zone is flipped, the bearish momentum has taken its strength, and the price failed to create a higher high rather than a lower high was formed showing a shift in structure.

    Now briefly about BTC as BTC influences, ALT’s a lot, BTC is showing bearish intentions as well which makes this bearish setup more strong.

  • KuCoin Token (KCS) – What can we Expect?

    KuCoin Token (KCS) – What can we Expect?

    At the time of writing, KCS is being traded at the rate of $21.88 with an increase of almost 4% within the last 24 hours.

    The low within this tenure was around $20.85 and the high was approximately $21.91. The coin as being in the watchlist of many traders makes it rank all the way up to number 74th according to the latest data released by coin market cap.

    KCS made its all-time high in the month of December 2021 where it reached an enormous amount of $28.776. At the moment it has a daily volume of $14,315,873 with a decrease of about 5.15% within the last 24 hours. The total supply of KCS is now around 170M and the circulating supply is also 80.1M. KCS has a dominance of 0.08%.

    The top exchanges for trading it are currently KuCoin, Probit Global, AscendX.

    Technical Analysis – KuCoin Token

    KCS has its chart just like a lot of similar coins. As BTC hasn’t shown any strength, we can see that the coins which haven’t been pumped have shown similar movements. Most of them have been consolidating for a lot of time. The price had a wick down from where it had grabbed all the liquidity that was present below.

    After this move, the price tapped in the daily order block (or we can say that it is retail support). From this point, the price of KCS had a bounce and it rallied upwards.

    KCS - 1D

    As a result, we have seen the formation of higher highs and higher lows. But a few days back. Price has created equal highs. As a result, we can expect that liquidity is present above this level. The market can move in such a way that it will grab the liquidity present above and then it can drop down breaking the retail support.+

    Price Prediction – KuCoin Token (KCS)

    KCS has been one of the most successful and powerful coins. The people have gained a lot, based on this coin. In the long run, traders are highly bullish on the project. The price of KCS has retraced back and is around the same price it had around the month of November 2021. According to the wallet investor, KCS is a good investment. The price of the coin is to reach a value of $42.55 in a year. In five years, the price is expected to reach around $120.544.

  • KuCoin Token (KCS) – Where will it go Now?

    KuCoin Token (KCS) – Where will it go Now?

    KuCoin Token (KCS) is the native token of KuCoin exchange that is used for a variety of purposes.

    At the time of writing this article, KCS has a value of $20.71 (0.11% increase today) with a trading volume of $13,471,492, with an increase of about 7% over the past 24 hours.

    KCS is listed on coinmarketcap in the 71st place. It has a market dominance of about 0.07%. KCS had created its all-time high around the price of $28.776 in December 2021 and later fell down to the price of $17.816 in the same month.  This month has been bearish for the price and we have seen a decrease of about 22.5% in December. November was however very bullish for the price and we saw an increase of about 47.12% in the price.

    The maximum supply of KCS is around 170M while the current circulating supply is around 80.1M coins.

    Technical Analysis – KuCoin Token (KCS)

    On the daily time frame, we can see that the price in the past had created an order block in the past. This was created when the price broke the last structure. This order block has been unmitigated for a long time.

    The price of KCS was consolidated for a long time and eventually did a fake-out which resulted in the drop in price. The price had dropped down to mitigate the order block. It can be seen that the price dropped for five-six consecutive days.

    KCS - 1D

    The price fell down to mitigate the order block. Now there is two points of interest that should be taken into notice. One is the equilibrium point of the consolidation zone. The second is the lower values of the price. This middle point can drive the price upwards from where we can expect a possible reaction. If the price becomes stable above, we can look for a higher high in the price. If the price fails to hold this level, chances are that we will go down to an even lower value in the price.

    Price Prediction – KuCoin Token(KCS)

    According to wallet investor, KCS is one of the most successful investments in the market. According to their predictions, KCS is expected to reach a value of $39.80 in a time span of one year. For a five year plan, the price is expected to reach a value of $114.672


  • KuCoin Token (KCS) price target at $17.74, analysis

    KuCoin Token (KCS) price target at $17.74, analysis

    KuCoin Token (KCS) is one of the best performers in the weekly timeframe. The cryptocurrency gained by nearly 100% in the past seven days. KCS coin is on a sharp uptrend with the bulls dominating the market for the cryptocurrency. At the time of writing, KuCoin Token stands at a price level of $13.90 with a positive change of 32% in the past twenty-four hours. The daily trading volume has also jumped upwards by more than 100%. KCS crypto’s trajectory may take it near the all-time high price of $21, although the cryptocurrency had not been able to break the ATH level even during the bull-run – suggesting a strong resistance.

    KuCoin Token technical analysis

    The technical for KuCoin Token shows the market sentiment to be strongly bullish. Out of the twenty-six technical indicators, sixteen are standing at a buy position with neutral and sell indications at five each. The oscillators suggest a sell position but that can be accounted to the sharp upward trend while the moving averages also indicate towards the long position.

    KuCoin Token technical analysis
    KuCoin Token technical analysis

    The Bollinger Band analysis for KuCoin Token shows the Bollinger Bands to be widening – indicating increased bullish momentum in the market. The KCS crypto has also broken a Fibonacci resistance level at 1.618 or $12.89, establishing it as strong support level. The next resistance lies at the Fibonacci level of 2.618 parallel to the price level of $17.74. In the daily timeframe, the most recent candle is bearish but the support level at $12.89 appears to be acting as a stabilizing region.

    What is KuCoin Token (KCS)?

    KuCoin Token is the native token of KuCoin exchange. The token allows users to capitalize from the exchange through profit sharing. KuCoin Token is an ERC-20 token based on the blockchain of Ethereum. It also has a deflationary mechanism with the initial supply set at 200 million tokens. The buyback and burning will continue until only 100 KCS tokens are left. The decreasing supply of the token may be contributing to its increasing value.

  • Top gainers last 5 days – (KuCoin Token, Bitcoin Gold, Ripple, Binance Coin, PancakeSwap)

    Top gainers last 5 days – (KuCoin Token, Bitcoin Gold, Ripple, Binance Coin, PancakeSwap)

    We have compiled a list of the top five best performing coins in the weekly timeframe. With phenomenal gains and growths, these cryptocurrencies have achieved a rank on our list.

    KuCoin Token (KCS) bags the first rank for the top performance in the weekly timeframe with a weekly growth of 88%. At the time of press, KCS was trading hands at $17.86 – which has decreased by 9%.KuCoin Token has a market ranking of seventy-eight with a daily trading volume of $109,501,368. KCS is the profit-sharing native token of the cryptocurrency exchange, KuCoin. The token is designed to become the key to the ecosystem of the exchange with further developments.

    The hard fork of Bitcoin, Bitcoin Gold (BTG) is another top performer of the week with a weekly growth of 74%. The cryptocurrency is priced at $107 which is still a long way from its all-time high of around $450 but the bullish momentum may overtake the price of the coin. Bitcoin Gold is ranked at 63rd position in the market and has a trading volume of $112,672,587. The hard fork has attempted to democratize the mining process of Bitcoin by allowing it to be mined on common GPUs.

    Ripple (XRP) has established itself safely above $1.50 and entered the weekly top performers’ list. Ripple achieved a growth of 74% after minor victories in the SEC lawsuit. Ripple Labs was granted access to discovery documents of BTC and ETH while the SEC was denied access to financial records of Ripple executives. XRP is making a comeback with regaining the fourth ranking in the market. Other favorable developments in the lawsuit may propel the cryptocurrency towards breaking its all-time high. 

    Binance Coin (BNB) has been one of the top performers of the current bull run and is the fourth best performer of the week with a growth of 47%. The coin established a new all-time high at $637 yesterday with a current price of $547. BNB is ranked at third place in the market. The cryptocurrency has been on a steep upward trend since the beginning of the 2021 bull run. BNB has multiple purposes being a payment method and the utility token of the Binance exchange.

    Last but not the least, PancakeSwap (CAKE) is the final top performer of the week with a rise of 38% in the price. The automated market maker (AMM) has established its all-time high at $25 in the week. It is priced at $24 at the time of press. CAKE is ranked at 40th in terms of market capitalization and has a daily trading volume of $1,083,145,899.