Polkadot (DOT) has been bearish ever since the establishment of its all-time high. However, the bearish momentum has slowed down in the recent timeframes. Although Polkadot is still moving downwards, it appears to be entering a consolidation phase with decreased bearish divergence. At the time of writing, Polkadot stands at a price level of $12.12. The price has stayed relatively stable in the daily timeframe with only a slight decrease of 3%. The daily trading volume has also decreased by 6%.
Polkadot (DOT) technical analysis
The market outlook for the cryptocurrency continues to be bearish. Out of the total twenty-six technical indicators, fifteen are giving out a bearish indication of sell with nine standing at a neutral position and only two indications at buy. The oscillators have turned neutral while the moving averages continue to be strongly bearish.
Polkadot (DOT) technical analysis
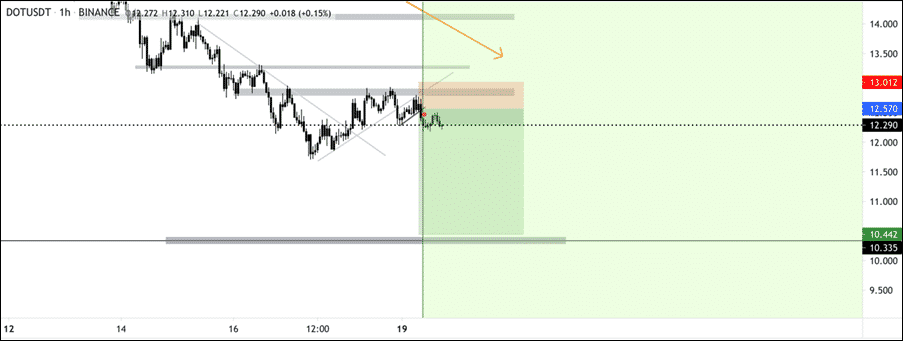
Polkadot (DOT) had formed a confluence of its up and down trend. In the shorter timeframes, the cryptocurrency is trying to reach upwards although the bears still dominate the market and upward trajectories cannot be sustained. If the current somewhat consolidation period results in the dominance of bulls, the immediate resistance levels will lie at the price level of $12.57 followed by $13.01. However, it is more likely for the cryptocurrency to continue moving downwards. The price level at $10.44 will act as a strong support level for the cryptocurrency.
Polkadot long-term price prediction
Although the cryptocurrency is bearish in the shorter timeframes, Polkadot focuses on the interoperability of blockchains – a proposition that is becoming more and more relevant to the blockchain space – which may result in a price explosion of Polkadot in the longer timeframes. The long-term price projections are; hence, bullish for Polkadot. Per the estimates of Wallet Investor, the one-year price prediction for Polkadot is at $56. Digital Coin Price predicts the same price level of $56 for Polkadot but for the year 2028.
Filecoin (FIL) had been declining sharply since the beginning of May. The bullish momentum of the bull run got lost as the bears began dominating the crypto market. Filecoin had been declining since with some minor upside movements that could not be sustained. At the time of writing, Filecoin stands at a price level of $46.57. The price had declined very slightly in the past twenty-four hours while the trading volume has increased. The volatility of the cryptocurrency has declined greatly, although the bulls are still dormant.
Filecoin (FIL) technical analysis
The market outlook for the cryptocurrency continues to be bearish. Out of the total twenty-six technical indicators, fifteen are giving out an indication of sell with nine indicators standing at a neutral position and only two indicators at a buy position.
Filecoin (FIL) technical analysis
Filecoin (FIL) had been identified to be operating in a descending channel formation since the beginning of July. The cryptocurrency had been decreasing sharply. After testing the support level at the lower boundary of the channel, Filecoin (FIL) saw slight bullish momentum and began moving upwards inside the channel. If the bullish momentum can be regained then an upward breakout from the channel is likely. In that case, the price targets at $55.20 followed by $73.55 will be activated. The support level at $43.5 at the lower boundary can be retested for an upside pullback or if the level fails to hold then the support level at $39.0 will help stabilize the cryptocurrency.
Filecoin (FIL) price prediction
The decentralized storage platform aims to “store humanity’s most important information”. With decentralization gaining momentum, Filecoin and other decentralized solutions will gain more importance. The price projections for Filecoin are bullish. Wallet Investor predicts a price of $575 in five years’ time – a staggering increase of 1,150%. Digital Coin Price is not as bullish on the cryptocurrency and projects a price of $163 by the end of the year 2026.
Tron (TRX) coin had been trending downwards as the whole cryptocurrency market turned bearish after the high of the 2021 bull run. The cryptocurrency suffered from some major corrections but was able to somewhat restore an upward momentum. At the time of writing, Tron crypto stands at a price level of $0.055. The cryptocurrency has been relatively stable in the past twenty-four hours with only a minor downside movement. The daily trading volume, on the other hand, has declined by more than 10%.
Tron (TRX) technical analysis
The market sentiment for Tron cryptocurrency is bearish. Out of the total twenty-six technical indicators, fifteen are giving out an indication of sell with eight indicators at neutral and only three standing at a buy position. The oscillators are neutral while the moving averages suggest a strong downtrend in the daily timeframe.
Tron (TRX) technical analysis
The bearish momentum of Tron is going strong. The cryptocurrency has been identified to be operating with a descending trend line since the beginning of July. The trend line has become even steeper as the bears further strengthened. Although a slight decrease can be observed in the bearish momentum with price volatility being decreased, the potential price target for Tron lies at the support level of $0.049. There is still a likelihood that the cryptocurrency will test the price level. However, the recent consolidating price movements may also suggest towards the end of the dominance of the bears. The upcoming price action will prove to be crucial for cryptocurrency.
Tron (TRX) price prediction
Tron is an operating system based on the blockchain which focuses on the content sharing and entertainment space. The blockchain is also known for its user friendliness in decentralized app development. Despite the current bearish outlook of the cryptocurrency, the long-term price forecasts are bullish. Tron is considered to be one of the good projects in the market with locked potential. The network regards its potential transaction per second to be at 2,000.
According to the estimates of Wallet Investor, Tron will be operating at a price level of $0.11 in a year’s time while the five-year projection places the cryptocurrency at $0.35. Digital Coin Price projects a similar path for the price of TRX crypto. Per their estimates, Tron will end 2021 with a price of $0.08 and reach towards $0.24 by 2028.
EOS (EOS) cryptocurrency has observed a decrease in its bearish momentum as the strong downward trajectory appears to have been broken. EOS coin continues to be bearish but the price action is consolidating with decreased volatility. At the time of writing, EOS stands at a price level of $3.66. The price has declined less than one percent in the past twenty-four hours while the trading volume has declined by 20%. The twenty-seventh largest cryptocurrency is in an indecisive zone.
The market outlook for cryptocurrency continues to be bearish. Out of the total twenty-six technical indicators, fourteen are giving out an indication of sell with ten indicators standing at a neutral position and only two signals bullish at a buy indication. The oscillators are neutral while the moving averages persist at a bearish outlook in the daily timeframe.
What is EOS and is it a good investment in 2021?
EOS is working towards the mainstream adoption and acceptance of blockchain technology. The platform of EOS is designed to help developers create decentralized applications with ease. In order to achieve its goal of blockchain technology’s adoption, EOS’s unique offering is the ease and simplicity of use. When compared with rivals, the platform of EOS comes out to be more user-friendly. EOS also takes further steps to ensure a better user experience through a variety of educational resources made available on the network for developers.
But is it a good investment in 2021? EOS is the twenty-seventh largest cryptocurrency in the market. Generally speaking, it is expected of legit cryptocurrencies to grow in the long term as blockchain technology will become increasingly relevant in the future. But with EOS’s vision, its focus of user experience, and scalability, the project can be considered one of the good bets in the market.
The price projections for EOS in the long-term are also bullish. Wallet Investor estimates the cryptocurrency to be operating at a price level of $4.67 in a year’s time while the five-year projection estimates a price level of $6.21. Digital Coin Price is more bullish on the cryptocurrency’s future. Per their estimates, EOS crypto will be standing at a price level of $5.4 by the end of the year while the price in 2028 is expected to be $16.54.
NEM or New Economy Movement aims to revolutionize the blockchain technology. With the tagline “Smart Asset Blockchain, Built for Performance”, NEM aims to help bring about the next generation of interoperable blockchains. NEM offers a seamless interaction between public and private blockchains. Through NEM, any kind of digital asset like tokens, files, etc. can be easily transferred.
History of the cryptocurrency
NEM is a hard fork of a popular cryptocurrency and payment platform, NXT. NEM evolved from the cryptocurrency in 2015. The organization behind NEM is a not-for-profit based in Singapore by the name of nem.io. After the fork, the development team decided to take the project a step further with its own codebase and more features. The team ensured to make NEM much more scalable and faster. It resulted in a platform that bore next to no resemblance with the original NXT.
The network was also given its own cryptocurrency by the name of XEM. XEM is not utilized as a payment method but it has still managed to climb the market ladder and currently is the sixty-third largest cryptocurrency by market capitalization.
NEM (XEM) fundamental analysis
NEM is not considered to have a large brand presence online but despite the fact, the support for the cryptocurrency is phenomenal. It may be considered as one of the most underrated cryptocurrencies with zero hype when compared with cryptocurrencies like Bitcoin. NEM also offers many advantages over the king of the market in terms of transaction speed and working mechanism.
NEM blockchain presents a unique mechanism for its high efficiency – the Proof of Importance (POI). The Proof-of-Work mechanism is one of the most common staking mechanisms in the crypto space but it is also an energy-intensive process which makes it undesirable. The NEM blockchain is much more efficient because of its POI mechanism which gives more importance to how much users are invested in XEM as evident by their wallets and holding period.
The development team of the network continues to strive for excellence and developments continue for NEM. The team has recently announced the successful launch of its Symbol mainnet. Symbol is described as an interoperable blockchain curated for asset tokenization. The launch of the Symbol mainnet also makes NEM a two-chain ecosystem.
XEM Technical Analysis
NEM has become the best performing cryptocurrency in the daily timeframe with a gain of 20% in the past twenty-four hours. The downtrend of the cryptocurrency may appear to be reversed as it gains upwards. At the time of writing, XEM stands at a price level of $0.14. The daily trading volume, too, has shot upwards by 300%. Is the market for XEM in a trend reversal?
The technical indicate a bullish market outlook for NEM. Out of the total twenty-six technical indicators, eleven are suggesting a signal of buy with nine at a neutral position and only six indicators bearish at a sell indication. Both the oscillators and moving averages are bullish.
XEM Technical Analysis
XEM coin had been operating in a descending channel formation since the beginning of July. However, the recent bullish trend in the market resulted in a break out from the descending channel towards the upside. Some crucial Fibonacci Retracement levels can be identified for the cryptocurrency. At the time of writing, XEM coin can be find reaching above the 1 Fibonacci Retracement at the price level of $0.14. The level had been resistance and can soon be established as strong support. The next resistance lies at the 1.618 Fibonacci level at the price of $0.16 which can also be regarded as the target price. If the upward trajectory is not maintained, XEM crypto can find various support levels to help it stabilize.
NEM (XEM) historical price movements
After its launch, the cryptocurrency had been operating below $0.01. The performance of XEM was subpar and just when all hope was lost, the bull run of 2017 occurred. XEM crypto established its all-time high at $2.09 during the bull run and gave a performance that wowed the market. The cryptocurrency also reached the top twenty largest cryptocurrencies in terms of market cap. However, the price could not be sustained as the market crashed in 2018, and XEM, once again, fell below $0.1.
XEM was once again pushed upwards by the bull run of 2021, although the performance was not as well as it may have been expected as XEM could not break its all-time high established in 2018. XEM was only able to establish its 52-week high at $0.77.
What does the future have in hold for NEM (XEM)?
The future projections for cryptocurrency are optimistic. A general upward trend has been confirmed by various estimations although the level may vary. According to Wallet Investor, XEM crypto is expected to be operating at a price level of $0.28 in a year’s time while the five-year forecast shows a price of $0.93 – an increase of nearly 550% in five years which is commendable. If the forecast of Wallet Investor plays out then investing $2,500 in XEM at the current price will result in gains of nearly $14,000 after five years. Isn’t that great?
Digital Coin Price is also bullish on the cryptocurrency and predicts XEM to end the year with a price of $0.21. Per their estimates, XEM is expected to reach towards $0.62 by 2028. Trading beasts on the other hand is not bullish on the cryptocurrency and projects a price of $0.23 by 2024 while suggesting near stagnant price movements for XEM.
Although a word of caution, these are bullish estimates, and the crypto market is notoriously known for its unpredictability and volatility so anything can happen at any time. Despite the bullish future projections, if you are not careful, XEM or any other cryptocurrency for that matter can tank all your investment. Hence, as much as a risk-lover you are, caution must always be practiced.
Binance Coin (BNB) appears to be the only cryptocurrency out of the large market cap ones to be moving upwards. The bulls have begun dominating the bears for Binance Coin as it started off on an upward trajectory. At the time of writing, BNB coin stands at a price level of $320. The price has increased by more than 5% in the past twenty-four hours while the trading volume has gone up by nearly 60%.
Binance Coin (BNB) technical analysis
The market outlook for the cryptocurrency is bullish. Out of the total twenty-six technical indicators, eleven are giving out an indication of buy while eight are standing at a neutral position and seven are bearish at a sell indication. The oscillators are bearish while the moving averages are bullish.
Binance Coin (BNB) technical analysis
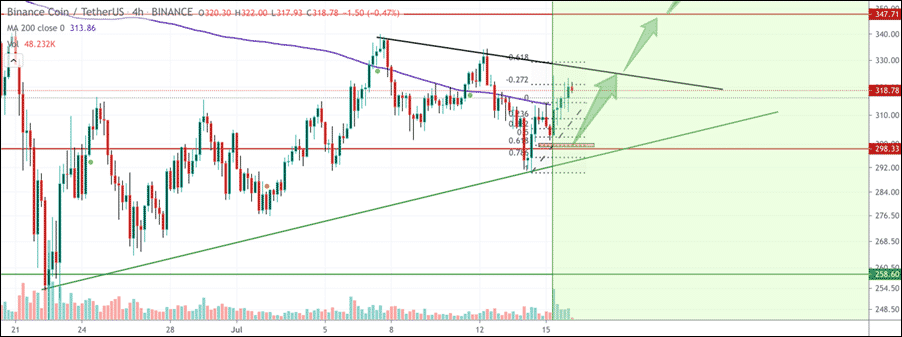
Binance Coin can be observed to be operating inside a triangle formation. The price of the cryptocurrency has been oscillating up and down inside the formation while testing the boundaries as resistance and support levels. Up till now, the upper and lower boundary have been established as strong resistance and support, respectively. The recent bullish trend can be seen helping BNB coin reach towards the upper boundary of the formation – towards a likely break out. The price target for the cryptocurrency has been set at $347.
Is Binance Coin (BNB) a good investment?
The market has been flooded with cryptocurrencies; however, investors regard more than 90% of the cryptos as junk with just a handful of them worthy of attention. With so many cryptocurrencies in the market, how can one decide which one is a good investment? Simple, its technology.
Binance Coin can be considered a good investment because of the underlying technology which is the Binance crypto exchange. Binance is the largest exchange by trading volume. The behemoth of an exchange also has a decentralized asset exchange – Binance Smart Chain – and an ecosystem of its own. Now, are there more chances of failure of a new cryptocurrency or of a large exchange like Binance? Hence, BNB coin possess locked potential.
Moreover, the future projections for the cryptocurrency are more than bullish. According to the estimates of Wallet Investor, BNB coin was be trading at $664 in a year’s time while the five-year projection places the coin at $2000.
BakeryToken (BAKE) is the best performing cryptocurrency in the daily timeframe. BAKE coin has increased by nearly 12% in the past twenty-four hours. The recent performance of the coin overtook Axie infinity – Ethereum’s gaming token which had been trending – in terms of performance. At the time of writing, BakeryToken stands at a price level of $2.31. The daily trading volume has shot up by more than 200% as the token gains momentum. BakeryToken is the ninetieth largest cryptocurrency in terms of market cap.
BakeryToken (BAKE) technical analysis
The market outlook for the cryptocurrency is bullish – a sight not common these days in the cryptocurrency market. Out of the total twenty-six technical indicators, eight are giving out an indication of buy with nine standing at a neutral position and only five at a sell position. The oscillators are mainly neutral while the moving averages suggest a strong uptrend.
BakeryToken (BAKE) technical analysis
BakeryToken has been under the formation of a falling wedge pattern. The bullish pattern got validated as the cryptocurrency broke out from the formation to the upside. The upside movement of the cryptocurrency is expected to continue for a while as it reaches towards various crucial resistance levels. The first potential price target lies at $2.82 followed by $4.57 and then $7.52. However, a trend reversal can also happen given how volatile the cryptocurrency market is. In that case, the first supporting price level will lie at $1.91 and BakeryToken should pullback from the price level. If not, then the next support lies at $1.51.
BakeryToken (BAKE) price prediction
BakeryToken is the native token of BakerySwap – a decentralized automated market maker. The token is used as a rewarding mechanism for providing liquidity. The future projections for the cryptocurrency are bullish. According to the estimates of Wallet Investor, BakeryToken is expected to have a price of $7.54 in a year’s time while the five-year price is expected to be at $29.27. The estimates of Digital Coin Price shows a price of $10 in 2028.
Internet Computer Protocol (ICP) has been staying relatively stable in the longer timeframe; however, the daily price actions have been marked with high volatility. In the past twenty-four hours, ICP coin peaked at $38 while the cryptocurrency is standing at $36 – the low of the twenty-four hours. The downward trend appears to continue ahead and ICP may establish a lower daily low as the day progresses.
The market outlook for cryptocurrency is bearish. Out of the total twenty-two technical indicators, eleven are standing at a position of sell with ten indicators giving out a neutral position only one indicator bullish with a buy signal. The oscillators are neutral while the moving averages suggest a strong downtrend.
Internet Computer price prediction
The ICP has taken a hit ever since the hyped down for the cryptocurrency; however, the long-term projections for the cryptocurrency are bullish. According to the estimates of Digital Coin Price, ICP is going to end the year with a price level of $55.51 while reaching higher over the years towards $157 by 2028. But not all projections are bullish. Wallet Investor projects a bleak future prospect and predicts the cryptocurrency to fall below $1.
Can ICP disrupt the crypto space?
The Internet Computer Protocol created a hype that stands unparalleled when it launched. Although the hype died down soon and users started raising concerns about the decentralization and security of the network, the offering of ICP still is very much appealing for a lot of investors.
The Internet Computer Protocol aims to create a decentralized computer which will completely eliminate the need for centralized services like hosting services, servers etc. With ICP, developers and firms can manage softwares without the need of centralized services. The network is also designed to have total interoperability which will allow the computer to operate more like an Internet of Things.
Aave (AAVE) has been one of the few cryptocurrencies performing well in the daily timeframe. While Aave coin has barely moved up in the weekly timeframe, the cryptocurrency increased by 6% in the past twenty-four hours. At the time of writing, the cryptocurrency stands at a price level of $282. Aave has been trending upwards with the daily trading volume also increasing.
Aave (AAVE) Technical Analysis
Despite the bullish trend of Aave, the market outlook for cryptocurrency is largely bearish. Out of the total twenty-six technical indicators, ten are suggesting a signal of the sell while ten stand at a neutral position with six indicators bullish. The oscillators are neutral while the moving averages suggest a downtrend in the daily timeframe.
Aave coin is currently in a support zone. The price range of $270 to $280 has been acting as a supporting zone for Aave and the cryptocurrency has stabilized in the region. The recent green candles indicate the strength of the support zone which can propel it further upwards. The upcoming price movement for Aave are expected to be bullish. A trader’s analysis reveals other crucial levels that are expected to be tested by the cryptocurrency. If the bullish momentum sustains, Aave can reach towards the resistance level at $315 followed by $435.
Aave (AAVE) price prediction
Aave is the largest DeFi protocol by market. As DeFi becomes more and more relevant to the real world, DeFi tokens like Aave are going to reach for the moon. The future projections for Aave are bullish. According to the estimates of Wallet Investor, the one-year price of Aave is at $804 while the price after five years is expected to be at $2,741. Digital Coin Price also predicts a bullish scenario for the cryptocurrency. Per their estimates, the cryptocurrency will end the year with $396 and reach towards $1,238 by 2028.
Crypto.com Coin (CRO) had been one of the few cryptocurrencies to show bullish momentum despite the bearish outlook for the cryptocurrency market. CRO coin had been moving upwards since the end of June and where cryptocurrency succumbed to the market’s bearish pressures, CRO continued its upward trajectory. At the time of writing, Crypto.com Coin stands at a price level of $0.122. In the daily timeframe, the price has declined slightly while the trading volume has shot up by 130%.
Crypto.com Coin technical analysis
In the four-hour timeframe, CRO coin has been moving upwards with minor downside movements. Given the strong bullish momentum in the market, the cryptocurrency can be expected to uphold the support level at the lower boundary of the channel formation. If the support level is established then the uptrend can be resumed as a pullback from the lower boundary will result in CRO coin going upwards. Although, in the daily timeframe CRO coin has been becoming increasingly bearish so a break out to the downside from the channel is not unlikely.
Crypto.com Coin Technical Analysis
The future price projections for the cryptocurrency are bullish. According to the estimates of Wallet Investor, CRO coin is expected to be operating at a price level of $0.20 in a year’s time while the five-year projection shows a price of $0.48 – an increase of 300%. The projections of Digital Coin Price are also hopeful for the cryptocurrency – albeit not as bullish. Per their estimates, Crypto.com Coin will reach towards $0.37 by 2028.
What is Crypto.com Coin?
CRO coin is the native token of the Crypto.com Chain. The blockchain is an open-source and public blockchain. It regards itself as the next generation blockchain. Crypto.com Chain is curated to be a public good in order to help boost the adoption of the blockchain technology. The decentralized platform is marked by low gas fees and lightning-fast speed. Crypto.com Chain is also one of the few blockchains that have taken the initiative towards sustainability. The blockchain has vowed to become carbon negative by the year 2023.
 coin long-term price prediction at")
 price prediction: Resistance at , analysis")

 Coin price prediction – Towards alt=")


 – Bulls to push towards 0")
 coin – Bulls to take BAKE towards")


 fueled by strong bullish momentum")
