Tag: QNT

  • A Snap of the Top Up & Down Movers of Past Week in the Crypto World

    A Snap of the Top Up & Down Movers of Past Week in the Crypto World

    The crypto world is bleeding red — investors are in a frenzy — the Kind and Queen are both in a downtrend. But even at times when fear is looming overhead and investors are treading low and slow, there are still coins/tokens making some good gains. Here are the top five gainers of the past seven days to watch out for:

    BarnBridge (BOND)

    Launched in 2020, BarnBridge (BOND) is a protocol for tokenizing risks. This altcoin from the DeFi sector has outperformed the market in the past seven days, as it gears up for its next phase, the anticipated release of version two (V2). Trading at $19.44 at the present, BarnBridge (BOND) has declined by 5.28% in the past 24 hours. This comes after a gain of 109.27% in the past seven days.

    Neoteric (NTRC)

    A soft fork of the RFI and Liquid on ERC-20, Neoteric (NTRC) has the combination token-mechanics of RFI and LIQ. The frictionless Yield Generation (Hold and Earn) and Perpetual liquidity meta-market-making mechanism of which grows liquidity with the execution of trades. In the past seven days, NTRC gained 134.88% while it has added 70.43% in the past 24 hours. Neoteric (NTRC) is currently trading at $0.004666.

    Saudi Shiba Inu (SAUDISHIB)

    A decentralized Finance (DeFi) token on the Binance Smart Chain (BSC), Saudi Shib Inu (SAUDISHIB) has an NFT platform and owns NFT collections. Moreover, the auto staking feature of the token imparts benefits to the holders from the reflections on every transaction. Currently, Saudi Shib Inu (SAUDISHIB) is hovering at $0.000000001063 with a decline of 42.13% in the past 24 hours. The token went up by 47.84% in the past seven days.

    Grove (GVR)

    Built for the future of our planet, Grove (GVR) is a decentralized, secure green token. Grove (GVR) promises a healthier and wealthier future in an environmentally conscious way. In the past seven days, Grove (GVR) shot up by 17.98%. The token is present in the red with a decline of 27.86% at a price of $0.00000000143.

    SpaceMine (MINE)

    SpaceMine (MINE) makes a solar planet metaverse where users mine minerals on planets. The minerals are then swapped with its tokens (MINE), which in turn are cashed in listed exchanges. SpaceMine (MINE) has continued trading in the green with seven-day gains at 140.39% and the past 24-hours gain at 6.18%. Currently, the token is trading at a price of $0.4106. Before this, the token managed to amass 12.12%% in the past seven days.

    Given the market situation and the wider bearish sentiment, there is no shortage of losers in the crypto world. Let’s have a look at the top five losers in the past seven days:

    Arweave (AR)

    Arweave is a decentralized storage network that hosts “the permaweb” — a decentralized web that has numerous community-driven applications and platforms. Arweave is focused on managing world-archived data to ensure zero tampering. Arweave (AR) spent the past seven days in the red with losses of over 16.83%. The token has added 1.25% in the past 24 hours at the current price of $12.47.

    Solana (SOL)

    Providing DeFi solutions, Solana (SOL) banks on blockchain technology’s permissionless nature. This highly functional open-source project has an innovative hybrid consensus model. Many experts anticipate the token to go big in the upcoming years despite the current bearishness. Solana (SOL) suffered quite a bit in the past seven days as it shed over 16.18%. The token is currently trading at $36.77, adding 2.47% in the past 24 hours.

    Aave (AAVE)

    Aave (AAVE), a decentralized finance protocol, allows users to lend and borrow cryptocurrencies. The token had been making some moves as DeFi recoveries gave a flicker of hope to crypto. But alas, the uptick could only last so long as the token then succumbed to corrections. AAve (AAVE) hence lost a value of 14.91% in the past seven days and is now trading at $82.22. This suggests an uptrend of 1.27% in the past 24 hours.
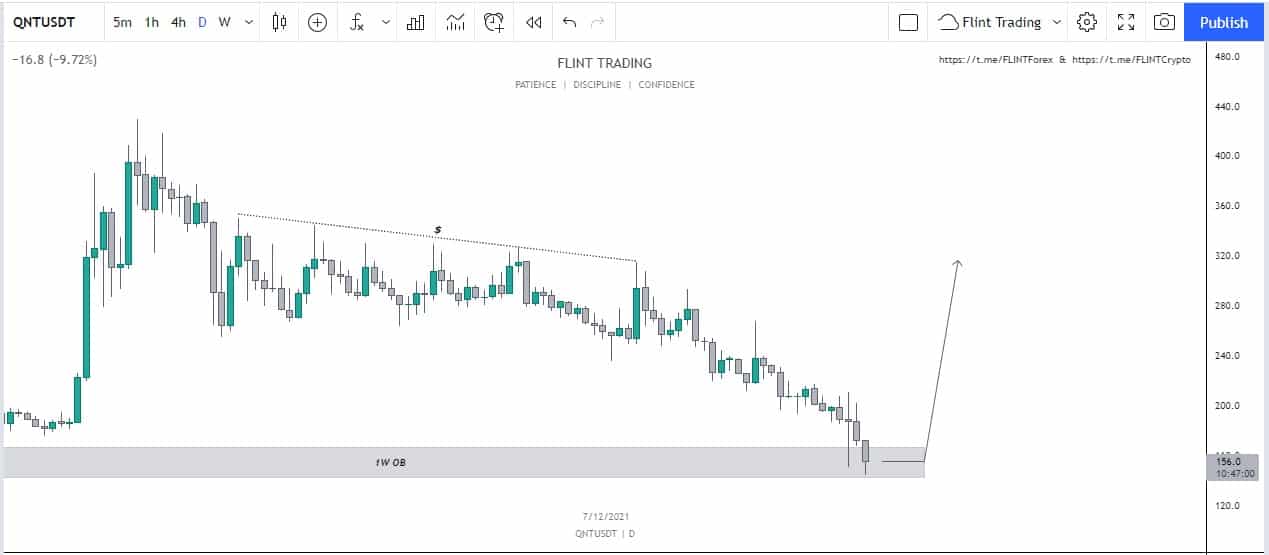
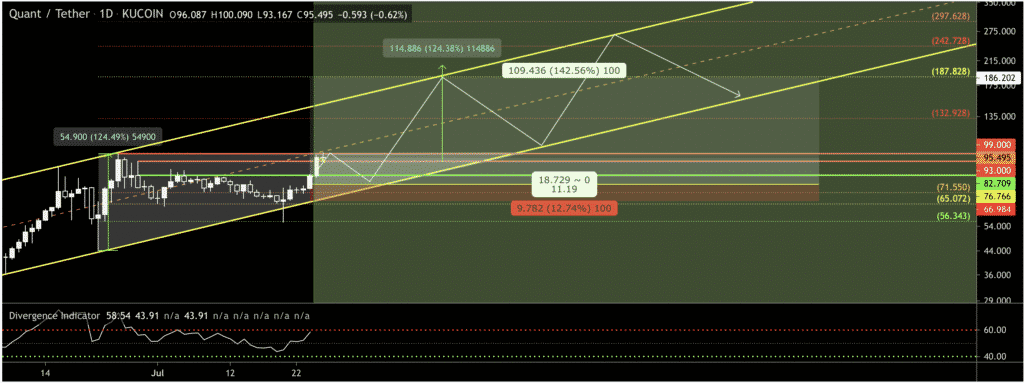
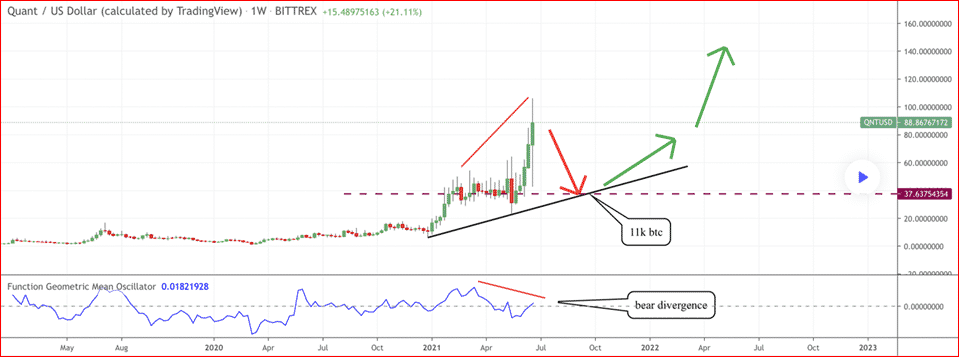
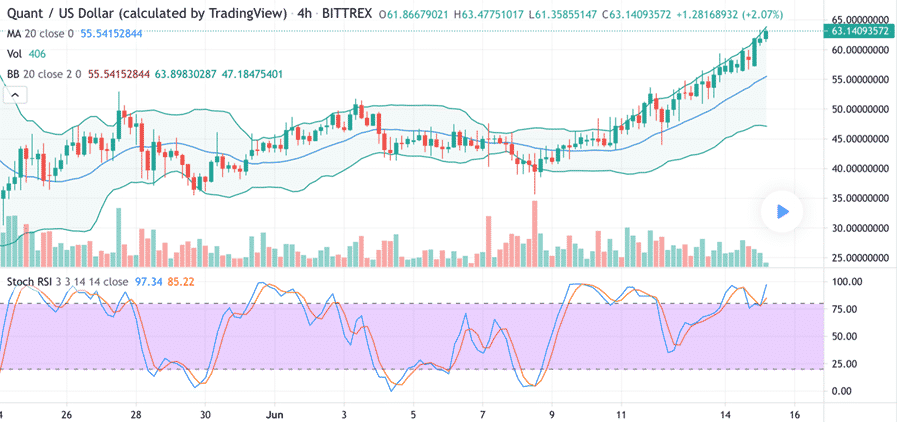
    Quant (QNT)

    Launched in June 2018, Quant (QNT) is the first project that solved the interoperability problem. It did so by creating the first blockchain operating system. With the aim of bridging the gap between different blockchains, Quant (QNT) is built as an operating system distributed ledger technology — and Overledger Network.  In the past seven days, Quant (QNT) has declined by 9.57%. The token is now trading at $95.02 with a gain of 14.48% in the past 24 hours.

    TerraClassicUSD (USTC)

    A decentralized, algorithmic stablecoin of the Terra blockchain, TerraUSD (USTC) is a scalable, yield-bearing coin. Value-pegged to the U.S. Dollar, TerraUSD (USTC) promises a higher level of scalability, interest rate accuracy as well as interchain usage. Having plunged by 9.93% in the past seven days, USTC is now trading at $0.03736. This marks an increase of 12.01% in the past 24 hours.

  • Quant (QNT) – Where will it move Now?

    Quant (QNT) – Where will it move Now?

    According to coinmarketcap, the total supply of QNT is around 14.6M QNT and the circulating supply is around 12.07M QNT. It holds the 67th rank according to market cap and has a market dominance of about 0.08%.

    At the time of writing QNT is being traded at the price of $156.56 with a decrease of almost 16.68% in the last 24 hours. QNT is a really strong token fundamentally. The maximum and minimum today are $194.20 and $146.64 respectively. The daily trading volume has decreased by almost 11.30%. QNT had created its ATH in September 2021 and reached a price of almost $430. The price later dropped down to a price of almost $145. Since then the price has started moving downwards and has been on the same trajectory since then. The past three months have been bearish. In December, we saw a decrease of about 23.53% and in November, it was around 28.81%.

    Technical Analysis – Quant (QNT)

    If we see the monthly time frame, we can see that the price has very much retraced back to the origin. The gains that we have had to come to the all-time high have been retraced back in the past two months with almost 30% in both months.

    Now the price of QNT is at a very critical level. After the price rallied upwards (as can be seen in the chart), the price had created an order block.

    QNT - 1D

    Soon after the ATH, the price shifted the structure and started to drop down. It tried to break out at many levels. But eventually, it got rejected several times from the trend line. The drop of BTC was the final blow to the price and we saw the price to mitigate the order block that I have talked about before.

    Now if the price can hold this level, we can soon expect a shift in the structure and a surge in the price of QNT.

    Price Prediction – Quant (QNT)

    According to wallet investor QNT is a good investment and is providing a great return. According to them, QNT is supposed to reach the value of $509.29 in a single year and in five years the price is expected to reach a value of $1877. But people who trade are quite optimistic about the price and think that it would reach quite a high value.


  • Quant Coin price prediction – QNT towards $114

    Quant coin is on a strong uptrend. The cryptocurrency is skirting close to its all-time high of $104 – with the current price only 7% down from the ATH. At the time of writing, Quant coin stands at a price level of $96. The price of the cryptocurrency has increased by 13% in the past twenty-four hours while an increase of 36% has been observed in the past seven days. The daily trading volume of QNT coin has jumped up by 130%. The cryptocurrency stands at seventieth rank in the market with a market cap of $1.1 billion.

    Quant technical analysis

    The market sentiment for Quant coin is bullish. Out of the total twenty-two technical indicators, fourteen are giving out an indication of buy with eight indicators standing at a neutral position. Only two indicators are at a bearish signal of sell. The oscillators are neutral while the moving averages are bullish.

    Quant Coin price prediction
    Quant Coin price prediction

    A trader’s analysis has identified Quant coin to be operating in an ascending channel formation since the beginning of July. The cryptocurrency has been oscillating up and down inside the formation. QNT coin has also been identified to have formed a coherent wave count. Minor corrections can be expected despite the primarily up trending market as QNT is on a wave count. The immediate price target lies at $114 on the upper boundary of the channel. The lower boundary is expected to be tested as support as well.

    Quant coin – Future outlook

    Quant has also been somewhat of an outlier and had previously maintained its bullish momentum despite a bearish market. The general bullish trend in the overall crypto market will prove to be beneficial for the QNT coin in achieving its bullish price targets. Wallet Investor estimates Quant coin will be operating at a price level of $94 in a year’s time while the five-year projection is at $471. Digital Coin Price has a similar price projection for the cryptocurrency. According to their estimates, Quant coin will end the year with a price level of $144 and reach towards $336 by 2026.

  • Cardano price prediction to $1 – Why is ADA bullish?

    As the cryptocurrency market turned bullish, so did most of the cryptocurrencies. Cardano has also begun showing a bullish move to the upside as the bulls regain their position in the market. The cryptocurrency – although bullish – has not started off on an uptrend and the trend, at large, still appears to be to the downside. At the time of writing, ADA coin stands at a price level of $1.40. The price has increased by 14% in the past twenty-four hours while the weekly performance has surged by 17%. The daily trading volume of the fifth-largest cryptocurrency has also increased by nearly 80%.

    Cardano price prediction

    The market outlook for the cryptocurrency is bullish. Out of the total twenty-six technical indicators, seventeen are suggesting a signal of buy with eight indicators standing at a neutral position and only one at a sell position. Both the oscillators and moving averages are bullish.

    A trader’s analysis has identified a possible trajectory for Cardano coin. Per the analysis, Cardano has been moving along a descending trendline; however, the recent bullish momentum has resulted in a break from the downward trendline. The cryptocurrency can find strong support at the price level of $1.04. Minor market corrections can also be expected from ADA coin as it retests the support at the descending trending but the price target at $1.60 appears to have been activated. If the price target is achieved, ADA can reach further high.

    What is pushing Cardano upwards?

    A mixture of technicals and recent developments may have boosted the bullish momentum of the cryptocurrency. But a large contribution can be attributed to the positive trend in the overall crypto market. Amazon had recently advertised job postings for cryptocurrency and blockchain. Subsequently, an anonymous source has revealed that the ecommerce giant has plans of accepting crypto payment with support for BTC, ETH, ADA, and BCH. Cardano founder, Charles Hoskinson, has revealed the development of a new upgrade for ADA. The new upgrade will enable Cardano to become compatible with web browsers and mobile applications.

    The boom of the crypto space and the upcoming developments of Cardano can definitely help the cryptocurrency cross the one-dollar mark and reach much higher.

  • Why is Quant (QNT) coin bullish?

    Why is Quant (QNT) coin bullish?

    Quant (QNT) established its all-time high at $104 three days ago. The cryptocurrency has been strongly bullish despite the bearish downtrend in the market. At the time of writing, Quant coin stands at a price level of $82. The price has moved upwards in the twenty-four timeframe while the daily trading volume has declined by 40%.

    Quant Technical Analysis

    The market sentiment for Quant crypto is bullish. Out of the total twenty-six technical indicators, fifteen are giving out a signal of buy with ten indicators standing on a neutral position and only on the indication of sell. Both the oscillators and moving averages are strongly bullish.

    Quant technical analysis
    Quant technical analysis

    Quant coin has been operating on an ascending trendline although the cryptocurrency moved upwards from the trendline amidst strong bullish momentum. As is the norm in the market, Quant coin can be expected to fall to bearish momentum after the strong price rally. If Quant is gripped by the bears, it can be expected to drop towards the earlier identified trendline. The trendline is acting as strong support and a bounce back to the upside can be expected from it.

    Why is Quant (QNT) bullish amidst a bearish market?

    The network has been very active recently with new developments going on which resulted in a price rally despite a bearish cryptocurrency market. The developments may also hint towards a continuation of the bullish outlook for cryptocurrency.

    Quant recently got listed on Coinbase pro – a feat not easy to achieve. As trading on Coinbase Pro began, Quant coin got propelled upwards. Before the listing, the development team of the network had also launched a technological upgrade which brought the cryptocurrency under attention. The new upgrade, Overledger 2.0, has received recognition from high-profile players like Oracle and Deloitte.

  • Quant (QNT) coin’s bullish momentum to end soon?

    Quant (QNT) coin’s bullish momentum to end soon?

    Quant (QNT) has been one of the best performing cryptocurrencies in the past week. Quant has had gains of 50% in the past seven days. Quant is skirting near its all-time high of $63 but facing strong resistance at the moment. At the time of writing, Quant stands at a price level of $61. The price has moved up by 6% in the past twenty-four hours while the daily trading volume has declined by 8%.

    Quant (QNT) Technical Analysis

    The market sentiment for the cryptocurrency is bullish. Out of the total twenty-six technical indicators, fifteen are giving out a signal of buy while nine stand at a neutral position with only two indications of sell. The oscillators have stayed neutral over the past week while the weekly moving averages suggest a strong uptrend in the cryptocurrency.

    Quant (QNT) technical analysis
    Quant (QNT) technical analysis

    The Bollinger Band analysis for Quant suggest that the cryptocurrency may be in oversold conditions. The Bands are widening which suggest increasing volatility for the cryptocurrency. The one-year price forecast by Wallet Investor suggests that the cryptocurrency will be trading at a price $119 while the five-year price prediction places the cryptocurrency at a price level of $365.

    What is Quant (QNT)?

    Quant is ranked at ninety-sixth position in terms of market capitalization. Quant was launched in 2018 with the aim of increasing the interoperability of blockchains in the industry. While a lot of scaling options exists for multiple blockchains, Quant targets the lack of interoperability in the blockchain space through an innovative approach. Quant is regarded as the first blockchain operating system for increasing the interoperability of blockchains. The underlying platform of Quant cryptocurrency is the Overledger Network. The Overlegder Network acts as an operating system and; hence, a bridge for different blockchains.