Tag: Technical Analysis

  • Measureable Data Token (MDT) – Will the Bearish Structure Stay?

    Measureable Data Token (MDT) – Will the Bearish Structure Stay?

    At the time of writing this article, MDT has a value of $0.08504 (22.57% increase today) with a trading volume of $118,144,452 with an increase of about871% over the past 24 hours. It has been of the top gainers today among the coins listed on Binance.

    MDT is listed on coinmarketcap in 519th place. It has negligible market dominance. MDT had created its all-time high around the price of $0.1788 in December 2021.  This month has been bullish for the price and we have seen an increase of about 40% in February. In January we saw a decrease of about 54%.

    The maximum supply of MDT is around 1B while the current circulating supply is around 673M coins.

    Technical Analysis – Measurable Data Token(MDT)

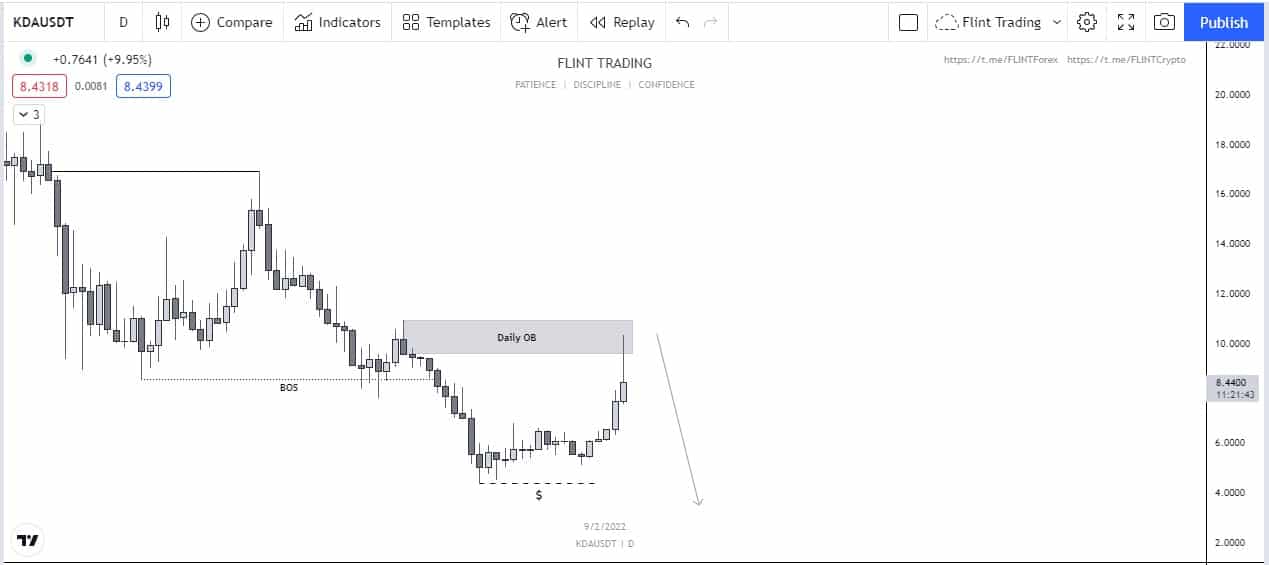
    If we talk about the technical portion of MDT coin, and starting from the daily time frame, the price on a macro scale is very bearish but that is just not too important. Although going with the trend is very favorable, like in this case, as macrostructure is bearish, it’s ideal to go with bears, but as price moves in waves, so one can also capitalize on the corrections which are bullish. Recently the price has tapped in a supply zone and has rejected quite much from that zone which shows that bears are interested in that level. The price did some inducement below so probably much liquidity has been taken which can drive the price downwards.

    MDT - 30M

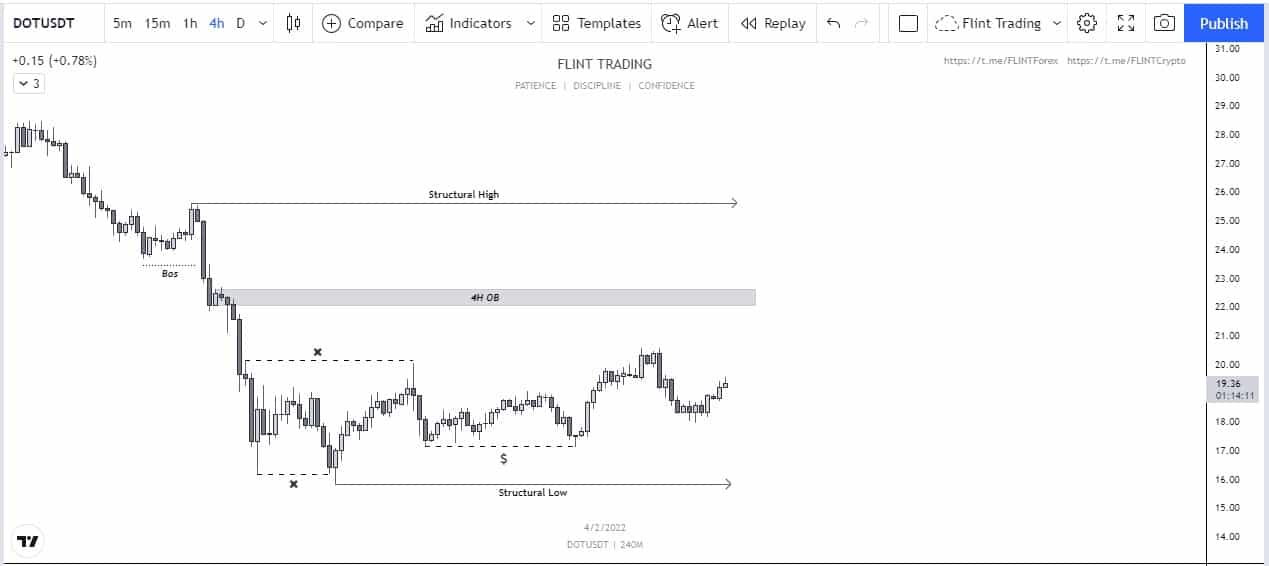
    Moving lower which is a 4 Hour Time Frame, the price was quite momentous when it was pushing upside, but after bears got in, and did some consolidation, the last bullish wave was not much momentous. As it’s not too clear so let’s just move to 30 minute Time frame directly.

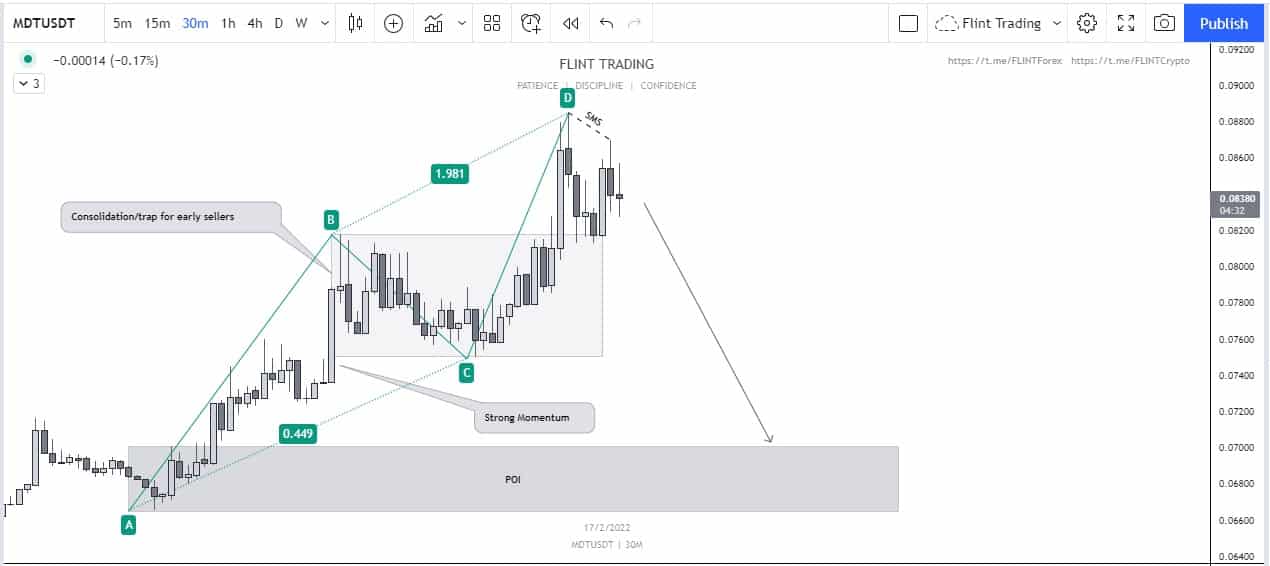
    In here the harmonic pattern ABCD has come to an end, and that end was within a supply zone, this makes the reversal strong. Talking about the structure, the price has done some Shift in the Market structure as it failed to create another high. Talking about invalidation the point of $0.09074 seems reasonable while the point of $0.7009 seems reasonable for the target

    Price Prediction – Measurable Data Token(MDT)

    According to wallet investor, MDT is one of the most successful investments in the market. According to their predictions, MDT is expected to reach a value of $0.0965 in a time span of one year. For a five-year plan, the price is expected to reach a value of $0.214.

  • Neo (NEO) -What is the Chart Showing Us?

    Neo (NEO) -What is the Chart Showing Us?

    Neo coin has been very bearish since it made its All-Time High which was in May 2021. The price has been making consecutive Lower Lows and Lower Highs. This shows that the macrostructure is very bearish at the moment, and unless and until the recent Lower High doesn’t get broken, the price can’t be considered as bullish, obviously on macrostructure.

    Checking out the Weekly Time Frame first, as mentioned above, the price on the macro scale is bearish but if the last time frame to analyze is 4 Hours, then the recent candles are only much more important. The price recently broke or we can say stop hunted the Demand level, which was at $22. After that stop hunt, the price has got the orders and liquidity which serves as fuel for the price to move in any direction. This has induced some bullish momentum within the price. Last week closed bearish and rejected from the recent supply level which is very clear on the Daily Time Frame.

    So moving to the Daily Time Frame, the Supply Zone, which was mentioned above is very clear and the price reacted very beautifully from that. The rejections were great and the bearish momentum which emerged was strong as well. Now talking about the structures, the price couldn’t break the Lower High which makes it still bearish on the Daily Time Frame. Right now the reason price is again at the same Supply level could be considered as an RTO move. Now as mentioned above, the Demand Zone was broken, and this Supply zone was the one which broke it so this Supply Zone is in control at the moment so talking about the strength of this zone, it can be considered as strong.

    Now moving down to the last Time Frame which is a 4 Hour one, there are some other confluences as well, which can drive the price down. Talking about the structures, the price when it got the momentum started breaking structures to the upside but once it tapped in that supply zone, it shifted its structure to the downside which shows bearish intentions. On lower Time Frame, it also made SnD flip, which makes the 4H supply even stronger. The price right now is within the POI can short can be taken, as imbalance and liquidity below also serves as a confluence for the price to drive down.

    Invalidation point can be considered as $26 while the target can be considered as $20.

  • The Graph (GRT) – What is the Chart Showing?

    The Graph (GRT) – What is the Chart Showing?

    So having a look at GRTUSDT, and checking the price action from the weekly time frame, the price seems very bearish structure-wise at the moment. Having a look at full and macrostructure on weekly is really not too important as 4H is the entry Time Frame, and targets and invalidation points are accordingly. But it’s important to check out the weekly levels and past weekly candles. Talking about the previous Low which was around $0.4306, the price recently stop hunted that. This has allowed the price to grab necessary liquidity which serves as fuel for the price to move in any direction. Now as it has grabbed, the price has the potential to move in the upward direction to make its Lower High. Talking about the candlestick anatomy, the previous week closed at bearish while the one before the previous was bullish. This week seems bullish as well, and if it does close as a bullish, this would be a double bottom on a lower time frame, and it shows bullish intentions.

    Moving down to the Daily Time Frame, GRT has some confluences for the upward movement as well, the price has clearly shifted structures to the topside, and the move down afterward was probably a process of mitigation. Now if momentum is observed, the way price came for mitigation and the way price bounced after mitigation shows a lot. There is a much difference in both of the momentum, and it clearly shows that buyers’ momentum is strong and they are interested.

    GRT - 4H

    Moving to the last time frame which is the 4 Hour time frame, GRT has shown some beautiful Price action. First thing, talking about the structure, it’s clearly broke to the upside in 4 Hours. The price when was pushing down started consolidating at one point which defiantly was a trap for buyers. It took out the early buyers by another push to the downside and once it goes the necessary liquidity, it bounced significantly to the topside. Supply was failed by the demand, and demand is in control. Moreover, the momentum is strong so it’s always ideal to go with the momentum. Now as the momentum is strong, it’s very less likely that it will visit the extremes again for some time unless BTC messes up, being the reason The breaker Block is a good POI as it aligns with Fibo Golden ratios as well as the Equilibrium of the previous consolidation. The invalidation point can be considered around $0.3888 while the target can be considered as $0.4958

  • Mina (MINA)  -What does the Chart Show?

    Mina (MINA) -What does the Chart Show?

    Moving to the technical side, and starting from the weekly time frame, the price of MINA has been bearish after it made its all-new all-time high. Recently it is around its all-time low, the drop has been massive and the price has been breaking structures to the downside. Recently the weekly low has been stopped hunted, as when MINA reached that Low, many traders were interested to get in, but they were taken out from the recent move. This allowed the price to get its necessary fuel which resulted in a momentous push to the upside. Moreover recently the harmonic pattern ABCD seems to be over which may result in a push-up of the price.

    Moving down the Daily Time Frame, the price recently has tapped in Daily Order Block, this Order Block is in confluence with the equilibrium of the consolidation range. This zone has added some bullish momentum to the price. Before this tap into the Order Block, the price of MINA did inducement as well which was to take out early buyers, and afterward, the price got the necessary fuel and pushed up.

    MINA - 4H

    Moving down to the last time frame, which is the 4 hour, the price when it was pushing down, the demand failed while the supply was in control. MINA when headed upwards, mitigated that supply zone which was in control and it got a rejection and fell a bit. Now as the bullish momentum is very strong, it’s very likely that it will result in a higher push. The price failed to create a new Low, which was a shift in market structure. This shows the price didn’t want to push much lower. Now there is much Imbalance left in the previous candle which acts as a magnet for the price to react. This can drive prices lower from where we can get in.

    Now as the momentum is very strong, so there are two POI from where the price of MINA can react at the moment. One is Order Block and the other is Breaker Block. AS mentioned the momentum is strong, so in such cases, the price is very unlikely to go to the extreme to react with the Order Block, so Breaker Block is a good Point of Interest and the price can very likely react to it. Talking about invalidation, if BB fails to react, then OB can also serve as a POI, and targets can be around the level of $2.895

  • Liverpeer (LPT) – What is the Chart Showing Us?

    Liverpeer (LPT) – What is the Chart Showing Us?

    At the time of writing, LPT is trading at $33.49, representing a 2.15 percent drop in the previous 24 hours.

    During this time period, the low was about $32.66 and the high was around $35.97. According to the most recent coin market cap statistics, the coin ranks as high as 102nd due to its market cap. It’s on the watchlist of many traders.

    LPT achieved an all-time high of $101 in November 2021, marking its all-time high. It currently has a daily volume of $72,138,270, a rise of almost 39 percent in the previous 24 hours. The overall supply of LPT is about 22.89 million, with a circulating supply of 21.16 million. LPT has a 0.04 percent market share.

    OKX, Binance, and Mandala Exchange are the leading exchanges for trading it right now.

    Technical Analysis – Liverpeer (LPT)

    Moving to the technical side, and starting from the Weekly Time Frame, the price is very much still in a downtrend as its breaks structures to the downside. Now talking about the macro structure price is still bullish as price has just one macro structure so it doesn’t provide much data, so avoiding that and just checking the microstructure, the price is still in a downtrend. Now recently as a downtrend is formed by consecutive Lower Highs and Lower Lows, the price can be considered in making a Lower High. Right now only 2 options are available which are for the price to make a Lower Low or break structure to the upside, but as it’s ideal to go with the trend, so the possibility of price making a Lower Low is far more preferred. Recently price is within a weekly Order Block as well.

    LPT - 1D

    Moving down to the Daily Time Frame, the price is within a golden ratio of Fibo, and that is in confluence with an Order Block, so it’s very likely that price may fall. Moreover, the price is shown some great rejection from the zone so, by candlesticks understanding, this is very much a reversal confluence.

    If the $39.48 level gets broken which is the last High, this whole scenario would get invalidated, while talking about the target, the level of $25.14 can be served as the TP1 while for TP2, the TP can stay open, as we never know where the next Lower Low may end.

    Price Prediction – Liverpeer (LPT)

    LPT has been one of the most strong and profitable currencies. People have benefited much as a result of this currency. Traders are quite positive about the project in the long run. LPT is an excellent investment, according to the wallet investor. In a year, the coin’s price is expected to reach $61.004. The price is predicted to rise roughly $178.624 in five years.

  • CRO – What is the Chart Showing Us?

    CRO – What is the Chart Showing Us?

    At the time of writing, CRO is trading at $0.5385, representing a 6.15 percent growth in the previous 24 hours.

    During this time period, the low was about $0.5002 and the high was around $0.5385. According to the most recent coin market cap statistics, the coin ranks as high as 16th due to its market cap. It’s on the watchlist of many traders.

    CRO achieved an all-time high of $0.975 in November 2021, marking its all-time high. It currently has a daily volume of $253,577,262, a rise of almost 66 percent in the previous 24 hours. The overall supply of CRO is about 30 billion, with a circulating supply of 25.26 billion. CRO has a 0.66 percent market share.

    OKEX, Bitget, and CoinTiger are the leading exchanges for trading it right now.

    Technical Analysis

    Moving to the technical side, starting from the weekly Time Frame, the major structure-wise, the price is still bullish but correction wise the price started breaking structure to the downside so minor structure is to the downside. Right now price is heading towards the weekly Order Block and has apparently tapped into that to some extent. Now it’s kind of ideal for the price of CRO to at least mitigate the half or equilibrium of the Order Block in order for us to consider that mitigated, which we are anticipating at the moment.

    CRO -1D

    Moving down to the Daily Time Frame, the price did the process of inducement, which obviously was a trap for early sellers who probably were taken out. The weekly order block contains a mitigation Block on the daily time frame, which gives a high probability that it’d hold. Just below that, there was an imbalance that acts as a magnet, and the price of CRO has probably filled that. This mitigation block lies in confluence with the golden ratio of Fibo as well. Now on LTF if the price shows a reaction to this zone, shorts can be taken. Talking about invalidation, if this zone gets violated, this whole scenario will get invalidated, while talking about the targets, the level of $0.4311 can serve as one as that is a Quasimodo level and an order block as well.

    Price Prediction – CRO

    CRO has been one of the most strong and profitable currencies. People have benefited much as a result of this currency. Traders are quite positive about the project in the long run. CRO is an excellent investment, according to the wallet investor. In a year, the coin’s price is expected to reach $0.972. The price is predicted to rise roughly $2.954 in five years.

  • Ethereum Classic (ETC) – What does the Chart Shows?

    Ethereum Classic (ETC) – What does the Chart Shows?

    Taking about the technical portion of Ethereum Classic (ETC) and starting that from the Monthly Time Frame, the price is still bullish if we talk about the structure-wise, but if we talk about the momentum and volume, the bears are in full control. As the price has almost retraced back fully which shows that bears are denominating against the buyers. For the past 3 months, the price of ETC has been extremely bearish and this running month is bullish but going with the flow, the price is still very bearish and it’s always good to go with the trend. Now as there is a demand zone below, it’s still some points away and it may take some time for the price to reach that so till then it’s good to go with continuations instead of anticipating any sort of reversal.

    Moving down to the weekly Time Frame, the first demand zone was clearly broken which was at $24.91 which shows that supply is in control, so the price of ETC is around that supply zone and a good reaction can be anticipated off that zone. On weekly, the structure to the downside is very visible and the order flow is clearly to the downside. As in bearish order flow, the price of ETC cycles are Lower Low and Lower Highs, this up move is merely a Lower High as it hasn’t broken any type of structure.

    Moving down to the daily Time Frame, the price of ETC recently reacted slightly from the last supply holding obviously on daily Time frame. This was a move of inducement to trap early sellers. Now it’s tapping in that Supply Zone which was mentioned above. Now within that supply zone, on a lower time frame to refine that, the price has an imbalance there. This Imbalance acts as a magnet and after filling that, it’s very likely that price may hit down.

    Possible Reaction Points

    Now the way price taps in the zone are very important. The way price is heading to this zone is very much corrective with corrective price action. This price action of ETC is very reliable in order to get the idea of whether the zone will hold or not.  Now, this zone is also within the premium pricing as well, and it’s ideal to sell from these areas. Now talking about the invalidation point, if this Daily imbalance gets violated, this whole scenario will get violated and the price may head to the next imbalance point, Talking about the targets the demand pattern at $28.90 can be considered as the first TP, and one can keep holding if BTC movement is preferable as the overall Higher Time frame direction is to the downside.

  • Kadena (KDA) – What does the Chart Show?

    Kadena (KDA) – What does the Chart Show?

    When talking about the technical analysis let’s start from the weekly time frame and understand the anatomy of the candle, the price of Kadena (KDA) is now around the weekly mitigation block and has shown a great reaction of it. Moreover, if we draw the Fibonacci from the last Lower High to the Lower low, the level of 61.8 aligns with this mitigation block with serves as a confluence to this level. Now the demand pattern which was sitting at between $5.3991 to $8.4063 was turned down from the coming supply which makes this supply of KDA in control. This supply zone is also at the same level on the Lower Time frame as it’s not too visible on the weekly time frame.

    KDA - 1D

    Moving down to the Daily Time frame, Structure wise we still are in a downtrend, as the last Lower High is still intact and just from that the price of KDA recently showed a reaction. This recent was an almost full retracement of the impulse which was due to BTC as it pumped much recently. As BTC has a high influence over other alts, this resulted in a pump in this coin as well but overall the structure is still downwards. Now as BTC tapped into a daily FVG and has shown a great reaction, that shows short bias, so with that understanding, the short on this coin seems reasonable. There is some liquidity at $4.3828 as well which can drive the price downwards.

    Point of Interests – Kadena (KDA)

    Moving to the 4 Hour Time Frame, the price of KDA has formed a bearish DOJI pattern which is a reversal pattern. If such patterns are formed not within a zone, that is probably a continuation pattern, otherwise, If these are formed in any Specific zone, which is Order Block in this case, that shows a reversal pattern. The price also has left some imbalance while it was pushing upside which acts as a magnet and price can drive down because of that.

    Talking about the premium and Discount areas, if those are drawn, the price of KDA is clearly is a premium pricing which prefers to short only. That is a very simple rule which is to sell high and buy low and the price of KDA has clearly made a Lower High so it’s good to sell and longs shall be avoided. Now if this zone gets violated which is at $10.9392 this whole scenario would get violated. Talking about the targets, the liquidity which was mentioned above can serve as a target.

  • Filecoin (FIL) – What is the Chart Showing Us

    Filecoin (FIL) – What is the Chart Showing Us

    Filecoin (FIL) is currently trading at a price of $23.46 after increasing by 8.33 percent in the previous 24 hours. On April 1st, 2021, FIL reached an all-time high of $238.20. Following that, the market reversed course and plummeted to about $39. The price subsequently displayed another reversal, but it wasn’t powerful enough, and the price continued to bleed.

    Technical Analysis – Filecoin (FIL)

    Price previously reacted in the drop base drop zone. This is an example of a supply and demand pattern. Historically, the price has shown a reaction from this zone. Because of the large number of orders at this position, and hence the generation of liquidity, the market is likely to revisit this zone.

    Now FIL was in a bearish trend for a while. We saw a continuous decrease in the price of the coin. Soon the price started to show reversal but still, the bullish structure has not come into play. The price of the coin is moving towards a daily order block from where the price can show some reaction. Lower time frame confirmations should be taken into consideration to look for a possible breakthrough or a reversal.

    About Filecoin (FIL)

    Filecoin is presently ranked 41st on coinmarketcap in terms of market domination (0.19 percent) and market capitalization. The project was initially conceived in 2014, and it intends to create a storage system that would “hold humanity’s most vital knowledge.” Whereas firms like Amazon and Google rely on centralized systems, Filecoin intends to provide decentralization to the system, allowing for greater data protection. During its initial coin offering (ICO) in 2017, the project raised moreover $205 million (Initial Coin Offering). This demonstrates how much interest investors have in the idea and how wonderful they believe it is. It is founded on Proof of SpaceTime as well as Proof of Replication.

    Price Prediction – Filecoin

    Traders think that FIL is a terrific investment that will bring excellent profits. Wallet investor, on the other hand, believes FIL is a horrible investment. However, they predict that in a year’s time, the price would rise to $23.05. The price is predicted to reach $25.796 in five years. FIL is not a good investment, according to this evaluation. However, traders believe it has a lot of potential because it is still a long way from its all-time high.

  • Polkadot (DOT) – How can the Price React Now?

    Polkadot (DOT) – How can the Price React Now?

    Moving on to the technical analysis for DOT, we will start from the weekly time frame, the price of DOT has very correctively approached the weekly time frame, and has been rejected off it. It has also made a famous pattern called head and shoulder and price has almost completed that. Now when these famous patterns are formed, they are very likely manipulated. A head and shoulder pattern according to the textbook shows bearish intention, so the majority would be expected a sell of this but as mentioned before, the institution tends to manipulate such patterns, so it’s very likely that they might push the price of DOT  towards the upside and take out the liquidity and then depending on the condition, the next move of the price can be anticipated.

    Moving down one Time frame, which is the daily time frame, the price is very clearly breaking structures to the downside, so this makes the order flow bearish. Now if we observe, after every Lower Low, the price is making Lower Highs and recently the price has just made a lower low so now according to the market structure, the next lower high can be anticipated which is to the upside so this gives a bullish bias again.

    DOT - 4H

    Lower Time Frame – DOT

    Now moving down to the 4 Hour time frame, the price within the structural range has shown some great confluences which overall shows that price may push to the upside. First talking about the structure, the price was pushing to the downside, but recently the price took out the sell-side liquidity and showed the change of character which according to Wyckoff shows bullish intentions. Now moreover the price to both sides created liquidity. The top side was recently cleared but the downside still remains intact, and it’s very possible that after taking out the below liquidity, it might push to the upside. Now talking about the targets, the order block which is at $22.03 remains unmitigated, which may drive the price upwards.

    Moreover, as there was some inducement and imbalance as well just below that order block, it’s very likely that that order block might hold or price may even react to it for some time. The first order block should be around $20.72 as that’s equal to highs and the price may stop hunt and fall. Talking about the invalidation point, in case if price violates the structural low, this whole scenario would get invalidated and other biases should have opted.