Tag: Technical Analysis

  • Solana (SOL) coin price prediction of $391 possible?

    Solana (SOL) coin price prediction of $391 possible?

    Solana (SOL) started off on an upward trend since the end of June. Solana has been gaining bullish momentum; however, it has now entered a consolidation phase with decreased volatility. At the time of writing, the cryptocurrency stands at a price level of $35. The price has increased slightly in the past twenty-four hours while the trading volume has also gone up by 20%.

    Solana (SOL) technical analysis

    The market outlook for the cryptocurrency is bullish. Out of the total twenty-six technical indicators, fourteen are standing at a buy position with ten indicators at neutral and only two suggesting a sell. The oscillators are neutral while the moving averages suggest a strong uptrend in the daily timeframe.

    Solana (SOL) technical analysis
    Solana (SOL) technical analysis

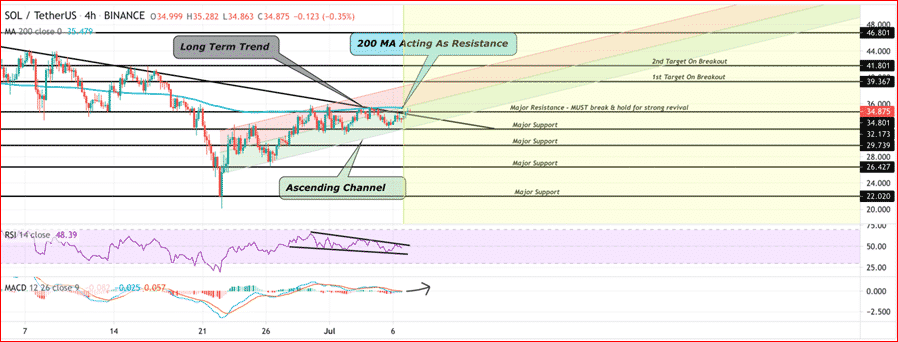
    A trader has identified various crucial levels for the cryptocurrency. Solana (SOL) is operating in an ascending channel formation. The cryptocurrency is currently near a major resistance level at $35. If Solana is able to break this resistance, it would confirm the bullish trend. The break out from the resistance level will activate price targets at $39 followed by $41.

    The price predictions for the cryptocurrency are favorable as it is considered a good long-term investment. According to the estimates of Wallet Investor, Solana is expected to be operating at a price level of $105 in a year’s time while the five-year projection shows a price of $391. Digital Coin Price’s forecast is not as optimistic but optimistic nonetheless. Per their estimates, Solana will end the year with a price of $51 and will continue climbing upwards till $153 by 2028.

    What might push the cryptocurrency upwards?

    Solana’s blockchain provides DeFi solutions. The network has been garnering increasing popularity. The Solana blockchain has had plenty of good projects working on it with plenty more under development. Recently, Solrise Finance – a decentralized asset management based on Solana’s blockchain – raised $3.4 million in its ICO. The number of good projects of the blockchain is increasing exponentially and the utility and potential of Solana is evident. This may help Solana achieve the optimistic price targets set for it.

  • Monero (XMR) coin upcoming price action

    Monero (XMR) coin upcoming price action

    Monero (XMR) has been under the bears as the market crashed after the bull run. Monero dropped to as low as $202 but it appears as though the cryptocurrency may soon reverse the trend. At the time of writing, XMR coin stands at a price level of $227. The price of the cryptocurrency has been gaining in the past twenty-four hours and so has been the trading volume.

    Monero (XMR) technical analysis

    The market outlook for Monero crypto is neutral which may indicate the onset of bullish momentum in the market. Out of the total technical indicators, ten are standing at a neutral position with nine giving out a sell signal and seven indications of buy. The oscillators are neutral as the price of the cryptocurrency may be consolidating while the moving averages suggest a bearish signal overall.

    Monero (XMR) technical analysis
    Monero (XMR) technical analysis

    Monero coin has been identified to have formed a falling wedge formation. The cryptocurrency has been experiencing decreased volatility inside the formation as it nears a break out. The falling wedge is a bullish pattern although the unpredictability of the market may lead to a downside breakout. Up till now, the price movements of XMR coin hints towards a possible upside break out from the formation. If the break out occurs upwards, the price level of $260 may be validated as the potential price target.

    New Monero mining malware

    Monero being a privacy coin can also prove to be useful for hackers. Where the anonymity and privacy of the cryptocurrency is what sets it apart, it also makes it a hotspot for cybercrime. Avast Antivirus has detected a new Monero mining malware called “Crackonosh”.Crackonosh is an advanced malware which can disable anti-virus mechanisms easily. Monero is being used by hackers to hijack computing resources for mining. A report also claims that Monero’s mining malware is responsible for 4% of its circulation. If the development team does not come up with a solution for this, the privacy feature may lead the cryptocurrency to its downfall.

  • Yearn.finance (YFI) coin being boosted by DeFi growth

    Yearn.finance (YFI) coin being boosted by DeFi growth

    Yearn.finance (YFI) peaked at $88,277 in the beginning of May. The cryptocurrency succumbed to bearish pressures and has been on a downhill ever since. However, recent price movements may indicate a reversal of the downward trend. At the time of writing, yearn.finance stands at a price level of $36,700. The price has moved upwards by 6% in the past twenty-four hours while the trading volume has gone up by 74%.

    Yearn. finance (YFI) technical analysis

    The positive price movement in the recent timeframes has also changed the market outlook from bearish to neutral. Out of the total twenty-six technical indicators, the buy and neutral indications stand at nine each while the sell signals are eight. The oscillators are mainly neutral while the moving averages are suggesting an uptrend with bullish indications.

    Yearn.finance (YFI) technical analysis
    Yearn.finance (YFI) technical analysis

    A trader has identified various crucial price levels for yearn.finance in their analysis. Per the trader, YFI crypto is operating on an ascending support line. The recent price action indicates an upward spike towards the horizontal resistance level at $55,325. It is also expected that yearn.finance will not be able to break the resistance level. If the scenario plays out, YFI coin’s bulls will die down soon and the bears will overtake the market. YFI crypto may be dumped until it reached the ascending support line again to stabilize. If the support at nearly $30k fails, the next support level can be found at $12k.

    What is yearn.finance (YFI)?

    Yearn.finance was launched in July 2020. The platform has garnered a lot of attention in a short span of time. Yearn.finance has a market rank of sixty-three in terms of capitalization – which is admirable given how new the project is. Yearn.finance’s aim is to simplify decentralized finance for investors. It acts as an aggregator service for DeFi investors and allows them to invest without requiring any technical knowledge about the DeFi space.

    The DeFi sector has been growing exponentially. In the past week, DeFi ranked second in sector-wise performance with a weekly return of 4.8%. Cryptocurrencies like Compound, Maker, Aave and Terra were some of the best performers in the sector; however, the growth of the sector pulls up all assets. Yearn.finance’s growth can be attributed towards the DeFi space’s growth.

  • KuCoin Token (KCS) price target at $17.74, analysis

    KuCoin Token (KCS) price target at $17.74, analysis

    KuCoin Token (KCS) is one of the best performers in the weekly timeframe. The cryptocurrency gained by nearly 100% in the past seven days. KCS coin is on a sharp uptrend with the bulls dominating the market for the cryptocurrency. At the time of writing, KuCoin Token stands at a price level of $13.90 with a positive change of 32% in the past twenty-four hours. The daily trading volume has also jumped upwards by more than 100%. KCS crypto’s trajectory may take it near the all-time high price of $21, although the cryptocurrency had not been able to break the ATH level even during the bull-run – suggesting a strong resistance.

    KuCoin Token technical analysis

    The technical for KuCoin Token shows the market sentiment to be strongly bullish. Out of the twenty-six technical indicators, sixteen are standing at a buy position with neutral and sell indications at five each. The oscillators suggest a sell position but that can be accounted to the sharp upward trend while the moving averages also indicate towards the long position.

    KuCoin Token technical analysis
    KuCoin Token technical analysis

    The Bollinger Band analysis for KuCoin Token shows the Bollinger Bands to be widening – indicating increased bullish momentum in the market. The KCS crypto has also broken a Fibonacci resistance level at 1.618 or $12.89, establishing it as strong support level. The next resistance lies at the Fibonacci level of 2.618 parallel to the price level of $17.74. In the daily timeframe, the most recent candle is bearish but the support level at $12.89 appears to be acting as a stabilizing region.

    What is KuCoin Token (KCS)?

    KuCoin Token is the native token of KuCoin exchange. The token allows users to capitalize from the exchange through profit sharing. KuCoin Token is an ERC-20 token based on the blockchain of Ethereum. It also has a deflationary mechanism with the initial supply set at 200 million tokens. The buyback and burning will continue until only 100 KCS tokens are left. The decreasing supply of the token may be contributing to its increasing value.

  • NEM (XEM) coin crypto price to reverse soon?

    NEM (XEM) coin crypto price to reverse soon?

    NEM (XEM) suffered from decreased bullish momentum during the bull run of 2021 as it could not establish a new all-time high. The 52-week high was recorded at $0.86 during the peak of the bull run. The cryptocurrency has been suffering from major bearish momentum ever since. At the time of writing, NEM coin stands at a price level of $0.12. The price and trading volume of the cryptocurrency is declining in the daily timeframe.

    The market outlook for Nem coin is bearish. Out of the total technical indicators, thirteen are standing at a position of sell with nine neutral indications and only four signals of buy. The oscillators suggest stagnant price movements while the moving averages indicate a strong downtrend.

    XEM

    Nem crypto had been operating in a falling wedge formation – which is a bullish pattern. The cryptocurrency has completed the formation and has broken out of it. The break out has been confirmed to the upside. Although XEM market is strongly bullish, the consolidating price movements coupled with the falling wedge formation may indicate the onset of bullish momentum in the market for Nem.

    What is NEM (XEM)?

    NEM or the New Market Movement has a visionary goal of transforming the blockchain ecosystem. NEM is not a platform but rather an ecosystem of platforms that are working towards utilizing cryptography and the blockchain technology to provide solutions for businesses and individuals.

    The development team of NEM is highly active and is undertaking various projects. NEM inaugurated the NEM Ventures Ignite Incubator Program to incentivize the development of the new economy. NEM also launched the mainnet of Symbol which will aid the evolution of the blockchain technology. The Symbol mainnet transforms NEM into a two-chain ecosystem. It will also act as a bridge between businesses and blockchain while increasing interoperability. The developments going on in the ecosystem may also help the cryptocurrency in the trend reversal.

  • Enjin (ENJ) coin price prediction – $9.48 in five years

    Enjin (ENJ) coin price prediction – $9.48 in five years

    Enjin (ENJ) crypto has been suffering from strong bearish divergence as is most of the cryptocurrency market. The cryptocurrency is on a downtrend and appears to be falling even lower. At the time of writing, Enjin coin stands ata. Price level of $1.08. The price has moved down by 6% in the past twenty-four hours while the daily trading volume has increased slightly.

    Enjin (ENJ) technical analysis

    The market sentiment for ENJ coin is bearish. Out of the total twenty-six technical indicators, fifteen are standing at a position of sell while nine indicators are neutral with only two giving out a signal of buy. The oscillators are neutral as the cryptocurrency is relatively stable while the moving averages suggest a strong down trend.

    Enjin (ENJ) technical analysis
    Enjin (ENJ) technical analysis

    Enjin coin had been operating along a downward resistance line after the all-time high was established. Currently, ENJ crypto has reached upwards towards breaking the resistance line. The current price level coincides with the resistance level. This may be an indication of the onset of bullish momentum for the cryptocurrency. If Enjin crypto does not get rejected at the resistance level higher price targets can be activated.

    Enjin (ENJ) price prediction

    Enjin is a social gaming platform where users can tokenize in-game items. The cryptocurrency had showed phenomenal growth during the bull-run; hence, it is considered a good project in the longer timeframes. Wallet Investors’ estimates place the cryptocurrency at a price of $2.70 after a year while the 5-year forecast suggests a price of $9.48. Digital Coin Price is not as bullish on the cryptocurrency although it, too, predicts the growth of ENJ coin. Per their estimates, Enjin coin will end the year at $1.62 while the price will continue to gradually climb upwards to $4.82 in 2028.

  • NEXO coin price movements – What to expect?

    NEXO coin price movements – What to expect?

    Nexo (NEXO) peaked at $4.05 in the beginning of May. The cryptocurrency succumbed to the bearish pressures in the market and fell drastically. Nexo coin is struggling to regain bullish momentum ever since. At the time of writing, Nexo stands at a price level of $1.32. The price has declined by 6% in the past twenty-four hours while the trading volume has also gone down by 11%.

    Nexo (NEXO) technical analysis

    The market sentiment for Nexo continues to be bearish. Out of the total twenty-six technical indicators, fourteen are giving out a signal of sell while ten are standing at a neutral position with only two indications of buy.

    Nexo (NEXO) technical analysis
    Nexo (NEXO) technical analysis

    Nexo coin is currently operating near a strong support level at the price of $1.03. The cryptocurrency is expected to stabilize at the support level if bearish divergence increases. On the upside, if the market trend is reversed and Nexo reaches upwards various resistance levels can also be found. The immediate strong resistance less at the price level of $2.16 – which is also the short-term price target – followed by $2.75 – the long-term price target for Nexo.

    What is Nexo (NEXO)?

    Nexo is a blockchain-based lending platform which offers instant cryptocurrency loans for borrowers and interest payments for lenders. Borrowers deposit cryptocurrencies as collateral – up to 20 cryptocurrencies accepted – and receive loans in fiat currency or stablecoins with no credit line checks as the process is fully automated.

    Cryptocurrency and fiat currency interest rates are as high as 12% per annum for lenders. Users can add or withdraw funds at any time. Nexo also has its Nexo card which allows users instant 2% cashback on all purchases with flexible repayment options. The Nexo card is accepted by more than 40 million merchants world wide.

  • Compound (COMP) coin price prediction – To cross $800 soon?

    Compound (COMP) coin price prediction – To cross $800 soon?

    Compound (COMP) has been bullish in the weekly timeframe despite the bearish cryptocurrency market. The cryptocurrency observed a growth of nearly 50% in the past seven days. At the time of writing, COMP coin stands at a price of $322. The price of the cryptocurrency has increased by 8% in the past twenty-four hours while the trading volume has jumped up by 35%. The cryptocurrency is underway reversing the down trend that had begun since the market crash.

    Compound (COMP) Technical Analysis

    Although the price movements of Compound show bullish divergence, the market for the cryptocurrency is neutral. Out of the total twenty-six technical indicators, ten are standing at a position of buy while the indications at neutral and sell are at eight each. The oscillators are bullish while the moving averages are neutral.

    Compound (COMP) Technical Analysis
    Compound (COMP) Technical Analysis

    Compound (COMP) had been operating on an upward trendline; however, the market crash resulted in the cryptocurrency breaking the support line. COMP coin fell to a low of $200 but the bullish momentum was restored as the cryptocurrency established support nearby. Currently, another support level at $325 has been established by COMP crypto. The bullish momentum may be expected to be furthered fueled by the establishment of the support level. If the bullish divergence is restored and maintained then COMP crypto can be expected to reach towards $826.

    Compound price prediction

    Compound is a DeFi lending protocol which allows users to earn interest on their cryptocurrencies. The growth potential of the cryptocurrency is high. According to the estimates of Wallet Investor, Compound is expected to be operating at a price level of $718 in a year’s time while the 5-year projection places the cryptocurrency at a staggering $2,554. Long Forecasts predictions state that the cryptocurrency will fell in 2021 to $264, after which the bullish trend will be restores. Per the estimates, the price of the cryptocurrency is expected to be at $774.

  • Telcoin (TEL) coin upcoming resistance at $0.052

    Telcoin (TEL) coin upcoming resistance at $0.052

    Telcoin (TEL) peaked at $0.059 in the beginning of May. In par with the market, Telcoin also began declining sharply as the market crashed. After falling to a low of $0.021, Telcoin has somewhat recovered. At the time of writing, the cryptocurrency stands at a price of $0.025. The price has been moving upwards in the past twenty-four hours while the trading volume has shot up by 150%.

    Telcoin (TEL) Technical Analysis

    The market sentiment for the cryptocurrency is neutral as the bulls and the bears are fighting over dominance. Out of the total twenty-six technical indicators, nine are standing at a buy position while eight are indicating a sell position and nine are neutral. The oscillators are bullish and the moving averages are bearish.

    Telcoin (TEL) Technical Analysis
    Telcoin (TEL) Technical Analysis

    Telcoin has been operating in a broadening ascending channel formation. The cryptocurrency had touched the upper boundary of the channel during the bull run while it is currently at the lower boundary – testing the support level. Telcoin is expected to bounce back from the lower boundary of the channel establishing it as strong support. If the support is established then the cryptocurrency will reach upwards towards the weekly resistance level at $0.52. The strength of the bullish momentum will determine the upcoming price movements of the cryptocurrency.

    Telcoin (TEL) Price Prediction

    The price predictions for the coin are bullish. The cryptocurrency is expected to continue to grow in the longer timeframes. Wallet Investor’s projections places the cryptocurrency at a price of $0.050 after a year while the 5-year forecast predicts Telcoin to be operating at $0.16. Digital Coin Price predictions are also favorable for the cryptocurrency. Per the estimates, Telcoin will end the current year with a price of $0.039 while the price in 2028 is expected at $0.11.

  • Bitcoin (BTC) – Will it rise up?

    Bitcoin (BTC) – Will it rise up?

    Bitcoin (BTC) – the king of the market – has been suffering immensely. The market crash brought Bitcoin from highs of $60,000 to $30,000. The market is undivided where one side believes in the potential of Bitcoin as a safe haven asset while the other side disregards the king and expects a dethroning soon. At the time of writing, Bitcoin stands at a price level of $34,279. The price has fallen by $500 in the past twenty-four hours while the trading volume has declined by nearly 7%.

    Bitcoin (BTC) Technical Analysis

    The market outlook for the king of cryptocurrencies continues to be bearish. Out of the total twenty-six technical indicators, fourteen are giving out a signal of the sell while nine stand at a neutral position with only three indications of buy. The oscillators are neutral while the moving averages are strongly bearish.

    Bitcoin (BTC) Technical Analysis
    Bitcoin (BTC) Technical Analysis

    An analyst has identified phases of the Wyckoff accumulation in the price action of Bitcoin. Bitcoin is currently identified to be operating in phase D of the accumulation. The current phase entails the price of the cryptocurrency holding above the support levels. Traders still identify the market to be bearish but various signs-of-strength and last-points-of-supply can be seen at this stage.

    The decreasing supply and gradually increasing supply in phase D leads to the final phase where traders and investors once again realize the bullish potential of Bitcoin. The cryptocurrency is expected to break various resistance levels in the final phase and it is also marked by increased volatility and volume.

    Will Bitcoin get back up?

    The indecisiveness with strong resistance levels may indicate Bitcoin to continue with bearish momentum. However, despite the disappointment Bitcoin continues to dominate the market with 45% dominance. It is still regarded as the premier cryptocurrency. The next halving of Bitcoin can definitely be expected to help restore Bitcoin’s position.