Tag: Technical Analysis

  • Maker (MKR) coin price prediction: Towards $4,400?

    Maker (MKR) coin price prediction: Towards $4,400?

    Maker (MKR) appears to be on the way of reversing its downtrend. The cryptocurrency is showing signs of increased bullish momentum. At the time of writing, MKR crypto stands at a price level of $2,719. The price has moved upward 16% in the past twenty-four hours while the daily trading volume has increased by 40%. Maker coin is bullish despite a largely bearish and indecisive trend in the market.

    Maker (MKR) Technical Analysis

    The market sentiment for Maker coin is bullish. Out of the total twenty-six technical indicators, ten are giving out a signal of buy while ten stand at a neutral position with only six indications of sell. Both the oscillators and moving averages are bullish.

    Maker (MKR) technical analysis
    Maker (MKR) technical analysis

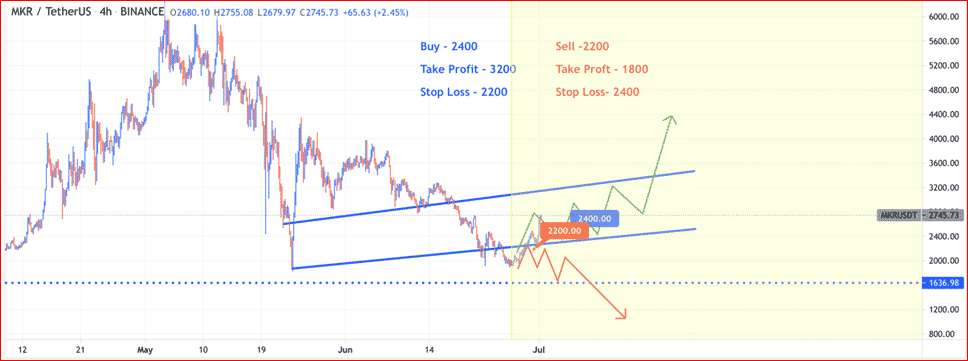
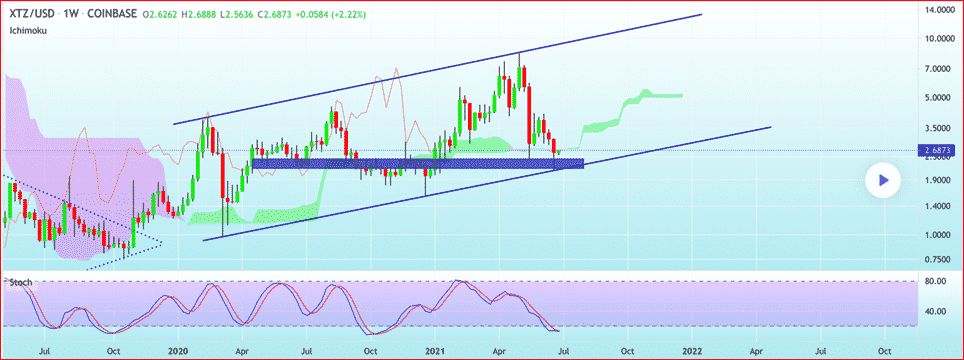
    Amidst the market bearishness, Maker coin had broken out of an ascending channel formation to the downside. However, the recent bullish momentum has helped the cryptocurrency reach back inside the channel. MKR coin appears to be operating on a coherent wave count. If the bullish divergence in the market for Maker continues, the price could reach much higher. In a bullish scenario, Maker can be expected to reach towards $4,400. However, if the bulls are not able to hold, then Maker crypto will find strong support at the price level of $1,636.

    What is Maker (MKR)?

    Maker (MKR) is the governance token of the MakerDAO. The decentralized organization is based on Ethereum’s blockchain and issues the DAI stablecoin which has its value soft-pegged to the US Dollar. MKR holders are given voting rights in the development of the protocol. Maker also helps to keep the value of DAI relatively stable. MakerDAO is considered as one of the earliest projects in decentralized finance where Ethereum can be used as collateral.

  • Tezos (XTZ) coin price towards $9 in 2025

    Tezos (XTZ) coin price towards $9 in 2025

    Tezos (XTZ) established its all-time high at $8.40 in the beginning of May. The market corrections resulted in a sharp fall of the cryptocurrency. Tezos coin has been moving downwards since the market crash. At the time of writing, Tezos stands at a price level of $2.99. The price has stayed relatively stable in the shorter timeframes with only a 2% upside movement in the past twenty-four hours. The daily trading volume has fallen by more than 10%.

    Tezos (XTZ) Technical Analysis

    The market sentiment for Tezos crypto is neutral. Out of the total twenty-six technical indicators, ten are standing at a sell position with nine indicators neutral and only seven bullish. The oscillators are neutral while the moving averages are bearish.

    Tezos (XTZ) technical analysis
    Tezos (XTZ) technical analysis

    Tezos has been identified to be operating in an ascending channel formation since the beginning of 2020. The cryptocurrency has been oscillating inside the channel formation and has not yet broken either of the boundaries yet. Tezos reached towards the upper resistance line as it established its ATH while on the other side, a strong support level can be found for the cryptocurrency along with the lower boundary’s support. Tezos may be showing signs of a price rally and a bullish bias can be expected from the cryptocurrency.

    Tezos (XTZ) price prediction

    Tezos cryptocurrency is expected to climb upwards in the longer timeframes; however, the growth may not be as substantial. Wallet Investor predicts the one-year price to be at $4.12 while the 5-year forecast places XTZ at $10.39. Digital Coin price predicts that Tezos will be priced at $4.46 by the end of 2021. XTZ coin will be operating at $9.59 in 2025 while the price at the end of 2028 will be skirting $13.

  • Shiba Inu (SHIB) coin price: Estimation to $0.000012

    Shiba Inu (SHIB) coin price: Estimation to $0.000012

    Shiba Inu (SHIB) has been consolidating ever since the brutal market correction. The cryptocurrency is now showing signs of the onset of bullish momentum. At the time of writing, SHIB crypto stands at a price level of $0.0000088. The price has increased by 5% in the past twenty-four hours while the daily trading volume has shot up by 100%.

    Shiba Inu (SHIB) Technical Analysis

    The market outlook for Shiba Inu is neutral as the price movement has yet to enter a decisive stage. The technical indicators are standing at an overall position of neutral. Out of the total twenty-six technical indicators, six are giving out a signal of sell while neutral and buy indications stand at eight each. The oscillators are bearish while the moving averages are bullish.

    Shiba Inu (SHIB) Technical Analysis
    Shiba Inu (SHIB) Technical Analysis

    Shiba Inu (SHIB) recently got rejected at a resistance level of $0.0000095. The price of the cryptocurrency began moving downwards after the rejection. However, a trader’s analysis shows that SHIB crypto will soon embark on an uptrend towards a resistance level at $0.00001. The price action at the resistance level will decide further future movements. A rejection may onset increased bearish divergence in the market.

    Shiba Inu (SHIB) Price Prediction

    Shiba Inu crypto does not have majorly favorable price predictions. Although the price of the cryptocurrency is expected to improve but not by a long margin. Shiba Inu belongs to the dog meme crypto community and the community has been subjected to criticism citing the cryptocurrencies do not provide any real value.

    Wallet Investor’s one-year forecast places the cryptocurrency at a price level of $0.000020 while in five years’ time the price will be hovering near $0.000067. Digital Coin Price predicts Shiba Inu to be valued at $0.000012 by the end of 2021 while the five-year price is at $0.000038.

  • VeChain (VET) coin : What is it & price prediction

    VeChain (VET) coin : What is it & price prediction

    VeChain (VET) peaked at $0.25 in the 2021 bull run. The cryptocurrency was under market corrections after the all-time high was established but bullish momentum was restored. However, the market soon crashed and VeChain fell to a 30-day low of $0.05.

    The recent price actions show that the cryptocurrencies may embark on an uptrend. At the time of writing, VeChain stands at a price level of $0.086. The price has increased by 6% in the past twenty-four hours while the trading volume has gone up by 30%. The technical indicators show a bearish market outlook with a majority of the indicators giving out a signal of sell rather than buy.

    What is VeChain?

    VeChain has a unique offering as it employs the blockchain technology – more specifically, the distributed ledger technology (DLT) – to improve business processes. VeChain’s aim is to enhance the supply chain process and improve the business ecosystem by increasing the efficiency of transfers.

    The roadmap of the network is ambitious with plans to become a platform where ICOs can be conducted and an intermediary between the Internet of Things (IoT) and other devices.

    VeChain (VET) price prediction

    VeChain (VET) is expected to move up in the longer timeframes. However, no phenomenal growth is expected from the cryptocurrency and it is expected to stay in the range of its discovery price. VET crypto’s future projections estimates the cryptocurrency will stay below $1. Wallet Investor’s price prediction places VeChain coin at a price of $0.23 after a year while the five-year forecast predicts a price of $0.86.

    Digital Coin Price also expects a similar price from the cryptocurrency. Per their estimates, VeChain will reach towards $0.12 towards the end of the year while the price at the end of 2028 is expected to be $0.40.

  • Chainlink (LINK) coin price prediction: Towards $30

    Chainlink (LINK) coin price prediction: Towards $30

    In line with the market trend, Chainlink (LINK) has been suffering from bearish divergence. The recent price movements show the cryptocurrency to be consolidating with decreased volatility. At the time of writing, Chainlink (LINK) stands at a price level of $18.90. The price has had a minor downside correction in the daily timeframe while the trading volume appears to be increasing.

    Chainlink (LINK) Technical Analysis

    The technical indicators suggest strong bearish momentum. Out of the total twenty-six technical indicators, fifteen are giving out a signal of sell while nine are neutral with two indications of buy. The oscillators are neutral while the moving averages are strongly bearish.

    Chainlink (LINK) technical analysis
    Chainlink (LINK) technical analysis

    Chainlink (LINK) had been previously identified to be operating below a descending trendline; however, the market observed bullish momentum which resulted in the cryptocurrency breaking the resistance line. Chainlink has now begun the formation of a coherent wave count. If the analysis plays out, Chainlink will be moving upwards – although with market corrections. LINK coin is expected to test the support level at $17.50 after which it will embark on an uptrend. The price target LINK crypto may be aiming for is $25 followed by $31.

    Chainlink (LINK) price prediction

    The decentralized oracle network had been under the spotlight in the bull run of 2021 with its offering being considered as crucial to the blockchain infrastructure. The long-term price predictions of LINK coin are favorable. Wallet Investor’s one-year price projection places the cryptocurrency at a price of $47 while the five-year prediction shows LINK crypto at $161.  Digital Coin Price also predicts an uptrend to be observed in the price action of Chainlink. According to their estimates, Chainlink will be operating at a price of $27 by the end of 2021 while the cryptocurrency is expected at $81 by the year 2028.

  • Ripple (XRP) coin lawsuit update: No Judgement But More Blows

    Ripple (XRP) coin lawsuit update: No Judgement But More Blows

    The US Securities Exchange Commission filed a lawsuit against Ripple Labs in December 2020. The SEC alleges that the firm has been involved in the sale of XRP as an unregistered security. The heated legal battle ensued does not appear to be reaching a judgment any time soon with both parties delivering blows after blows.

    Ripple Labs to call ex-SEC director

    In the most hyped legal battle of the year, Ripple Labs has achieved yet another break with its motion to call the previous director of the SEC Corporate Finance division, William Hinman, to testify. The counsel of Ripple Labs believe that Hinman may have knowledge of the SEC’s policies regarding digital assets which may prove to be crucial for the case. However, the motion may be quashed by the SEC as it has plans to counter it. The SEC has requested a discussion with the presiding judge Sarah Netburn regarding quashing the motion as the commission believes, if granted, the motion will set precedent for the company to dispose of high-ranking government officials.

    XRP Technical Analysis

    Ripple (XRP) fell brutally as the lawsuit was announced. The cryptocurrency recovered eventually during the bull run of 2021 with updates from the lawsuit proving to be irrelevant to the price movements. Ripple (XRP) is on a strong downtrend since the market crashed. The cryptocurrency currently stands at a price level of $0.67. The price of XRP coin has been increasing in the daily timeframe while the trading volume has also been increasing rapidly.

    The market sentiment for Ripple (XRP) continues to be bearish. Out of the total twenty-six technical indicators, fifteen are standing at a sell position with nine neutral indications and only two bullish indicators of buy. The oscillators are mainly neutral while the moving averages suggest a strong downtrend.

  • Binance Coin (BNB) to confirm an uptrend?

    Binance Coin (BNB) to confirm an uptrend?

    Binance Coin (BNB) had succumbed to bears once again after picking up the pace since the market crash. BNB coin appears to be mildly consolidating which may indicate the onset of bullish divergence. At the time of writing, Binance Coin stands at a price level of $294. The price has not been moving much in the past twenty-four hours. The daily trading volume has been rising incrementally.

    Binance Coin (BNB) Technical Analysis

    The market sentiment for Binance Coin is bearish. Out of the total twenty-six technical indicators, thirteen are standing at a sell position while nine are neutral and four are signaling a buy. The oscillators are neutral while the moving averages are suggesting a strong downtrend.

    Binance Coin (BNB) technical analysis
    Binance Coin (BNB) technical analysis

    The technical analysis of Binance Coin shows that the cryptocurrency has broken out of a bullish formation. Binance Coin can be observed to be moving upwards. Although the upward trend has yet to be confirmed yet, the candles in the shorter timeframes do show a plausible possibility of a reversal of the downtrend. The Fibonacci Retracement levels are acting as strong support and resistance. If the upward movement is confirmed, Binance Coin can be expected to reach towards $322 at the 0.5 Fibonacci level followed by $348 and $381.

    Incoming lawsuit for Binance Coin (BNB)?

    The SEC vs Ripple Labs lawsuit has made it evident that the SEC is planning to go after cryptocurrencies full force. Once the dust settles for the current lawsuit, the SEC may be planning to target other altcoins. Attorney Jeremy Hogan thinks that Binance Coin and tether may be the next picks of SEC. Hogan has been following the SEC vs. Ripple Labs lawsuit closely and per his expert analysis, both Binance Coin and Tether are at risk of a SEC probe.

  • Polygon (MATIC) coin price prediction

    Polygon (MATIC) coin price prediction

    Polygon (MATIC) has been trending downwards ever since the market crashed. MATIC coin has been struggling with bearish momentum and the bulls could not sustain the coin. At the time of writing, Polygon stands at a price level of $1.12. The price has gone up by 5% in the past twenty-four hours while the daily trading volume has declined by the same proportion. Matic coin is the sixteenth largest cryptocurrency in the market.

    Polygon (MATIC) Technical Analysis

    The market sentiment for cryptocurrency is bearish. Out of the twenty-four technical indicators, ten are standing at a sell position while ten are standing at a neutral position with six indicators giving out a buy signal. The oscillators are neutral while the moving averages are bearish.

    Polygon (MATIC) technical analysis
    Polygon (MATIC) technical analysis

    Matic coin has been brutally bearish. The cryptocurrency fell towards $1 – testing the support level. The support level of $1 appears to have held for now and some bullish momentum has been restored as the coin is moving upwards. A trader’s analysis suggests that Polygon will sustain its upward movement and move towards breaking the strong resistance level which lies at the price level of $1.89.

    Polygon (MATIC) price prediction

    Polygon raise to fame amidst the bull run of 2021 as the cryptocurrency showed a phenomenal performance. The project is considered as the debut of Indian developers into the cryptocurrency sphere despite the Indian government’s ban on cryptocurrencies. Polygon network is for the scaling of Ethereum and the network aims to increase connectivity and multi-chain blockchain infrastructure.

    Wallet Investors’ estimates suggest astounding growth of the network. The one-year projection places the cryptocurrency at a price level of $7.24 while the 5-year forecast suggests a price level of $30.59.

  • Ethereum (ETH) coin bearish momentum to end soon?

    Ethereum (ETH) coin bearish momentum to end soon?

    Ethereum (ETH) – the queen of the market – has been on a downtrend ever since the high of the bull run. While once Ethereum was trading hands at $4,000, now the queen of the market is barely above $2,000. At the time of writing, ETH coin stands at a price level of $2,055. The price of the crypto has moved up by 11% in the past twenty-four hours while in a weekly timeframe there has been a decline of $6. The daily trading volume of the cryptocurrency is also increasing.

    Ethereum (ETH) Tchnical Analysis

    The market sentiment for the cryptocurrency is bearish. Out of the total twenty-six technical indicators, ten are standing at a sell position and ten are at a neutral position while six are giving out a signal of buy. The oscillators are neutral while the moving averages are strongly bearish.

    Ethereum (ETH) technical analysis
    Ethereum (ETH) technical analysis

    The bearish momentum of ETH crypto is believed to end soon. As the market crashed, the cryptocurrency appears to have cooled down and the bullish momentum will resume once again. A trader has identified to begin moving towards $3,000. Ethereum is currently operating in a safe supporting zone. The coin is expected to stabilize. Although there is a possibility of falling further, ETH is expected to stabilize and reverse its trend at the supporting zone.

    Lowest gas fees on the Ethereum blockchain

    As Ethereum was moving upwards, the gas fees at the blockchain skyrocketed. The transaction fee went as high as $70 on average and currently it is at $2.15 – the lowest in six months. The declining gas fees make transactions more efficient on the network but it is also indicative of a rapidly decreasing demand for Ethereum. The long-anticipated ETH2.0 upgrade may help revive demand for the cryptocurrency.

  • Why is Quant (QNT) coin bullish?

    Why is Quant (QNT) coin bullish?

    Quant (QNT) established its all-time high at $104 three days ago. The cryptocurrency has been strongly bullish despite the bearish downtrend in the market. At the time of writing, Quant coin stands at a price level of $82. The price has moved upwards in the twenty-four timeframe while the daily trading volume has declined by 40%.

    Quant Technical Analysis

    The market sentiment for Quant crypto is bullish. Out of the total twenty-six technical indicators, fifteen are giving out a signal of buy with ten indicators standing on a neutral position and only on the indication of sell. Both the oscillators and moving averages are strongly bullish.

    Quant technical analysis
    Quant technical analysis

    Quant coin has been operating on an ascending trendline although the cryptocurrency moved upwards from the trendline amidst strong bullish momentum. As is the norm in the market, Quant coin can be expected to fall to bearish momentum after the strong price rally. If Quant is gripped by the bears, it can be expected to drop towards the earlier identified trendline. The trendline is acting as strong support and a bounce back to the upside can be expected from it.

    Why is Quant (QNT) bullish amidst a bearish market?

    The network has been very active recently with new developments going on which resulted in a price rally despite a bearish cryptocurrency market. The developments may also hint towards a continuation of the bullish outlook for cryptocurrency.

    Quant recently got listed on Coinbase pro – a feat not easy to achieve. As trading on Coinbase Pro began, Quant coin got propelled upwards. Before the listing, the development team of the network had also launched a technological upgrade which brought the cryptocurrency under attention. The new upgrade, Overledger 2.0, has received recognition from high-profile players like Oracle and Deloitte.