Tag: Technical Analysis

  • Uniswap (UNI) coin to test support level soon?

    Uniswap (UNI) coin to test support level soon?

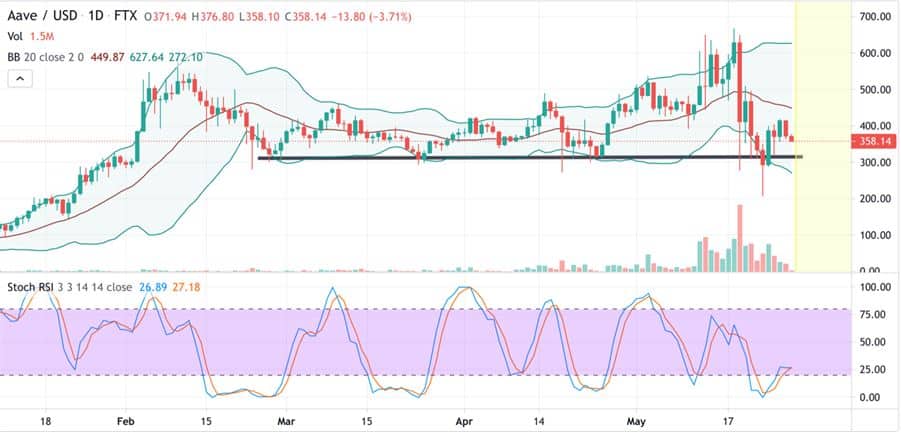
    Uniswap (UNI) has declined by nearly 3% in the past week – suggesting a bearish outlook for the cryptocurrency. UNI coin went as low as $15 amidst the market crash but has recovered since although the cryptocurrency has not begun an uptrend yet. At the time of writing, Uniswap (UNI) stands at a price level of $27.16. The price has been declining in the past twenty-four hours while the daily trading volume has been increasing.

    Uniswap (UNI) Technical Analysis

    The market sentiment for Uniswap is bearish as the cryptocurrency is declining. Out of the total technical indicators, eleven are giving out a signal of sell, eight are standing at a neutral position while seven are indicating a buy signal. Both the oscillators and moving averages are bearish.

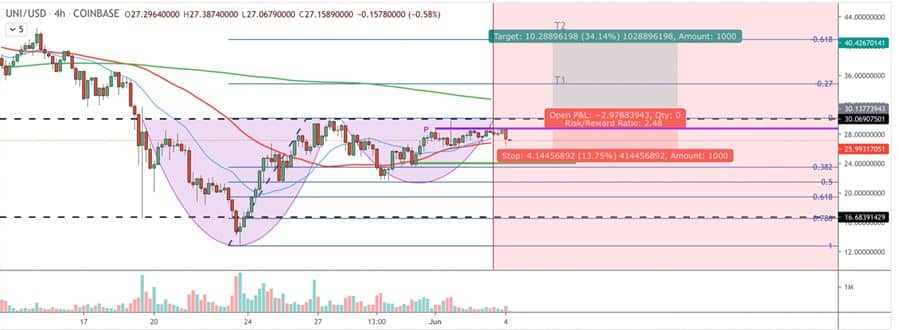
    Uniswap (UNI) had been identified to have formed a cup and handle formation. The bullish formation had yet to be confirmed by the price movements; however, Uniswap failed to confirm the formation as the price did not break above the neckline. Uniswap can also be seen to have been rejected a few times at the price level of $28 – making it a major resistance level. The cryptocurrency is also being supported by the price level of $24. Currently on a downtrend, Uniswap can be expected to test the support level.

    Uniswap’s controversial proposal

    Harvard Law School Blockchain and FinTech Initiative has made a governance proposal to set aside funds for political lobbying in favor of DeFi as the threat of regulation looms. The proposal would finance political groups that are working against DeFi regulation. The proposal had been controversial as many stakeholders think it unfair for a few lawyers and a single organization to manage lobbying funds. However, the proposal had been gaining popularity as well. ConsenSys – the Ethereum solution provider – has also expressed its support for the proposal and after securing a majority of favorable votes, the proposal is set to move forward to a full vote stage.

  • Cardano (ADA) – Strong resistance ahead

    Cardano (ADA) – Strong resistance ahead

    Cardano (ADA) peaked at $2.46 in the 2021 bull run. The cryptocurrency subsequently fell to a low of $1.03 in the market corrections. The price movements of the ADA coin had been highly volatile ever since as a stable zone is to be yet identified. Cardano had been trying to reach upwards but its trajectory is being hindered by a strong resistance it is facing. At the time of writing, ADA crypto stands at a price level of $1.74. The price had been slightly declining the past twenty-four hours while the daily trading volume has increased by 30%.

    Cardano (ADA) Technical Analysis

    The market sentiment for Cardano coin is bullish. Out of the total twenty-six technical indicators, fourteen are giving out a signal of buy while nine are standing at a neutral position with just three indications of sell. The oscillators are neutral while the moving averages suggest a strong uptrend.

    Cardano (ADA) Technical Analysis
    Cardano (ADA) Technical Analysis

    Cardano has been identified to be facing strong resistance.  The price level of $1.83 is acting as a major resistance level and the ADA coin has suffered multiple rejections at the resistance level. ADA crypto also has established the $1.31 price level as a strong support level and it had been oscillating between the two levels. Cardano coin has shown bearish divergence in the recent timeframes which may indicate that the cryptocurrency will be testing the support zone once again. However, in the longer timeframes, ADA crypto is expected to break the resistance level and reach towards its all-time high price of $2.46.

    Cardano’s first cross-chain bridge

    Cardano has announced to launch its first cross-chain bridge in six weeks. The bridge will connect Cardano’s blockchain with the Nervos network – increasing their interoperability. This will be a hallmark moment for Cardano as this is the first bridge to be launched. The bridge will link both the networks allowing users to interchangeably use the native tokens of the networks – reducing transaction cost and increasing efficiency.

    The hallmark moment for Cardano will definitely result in increased bullish momentum for ADA crypto. The success of the bridge will also open new avenues of success for the blockchain.

  • Kusama (KSM) to break $1,000 soon?

    Kusama (KSM) to break $1,000 soon?

    Kusama (KSM) is the highest performing cryptocurrency in the top 100 in the weekly timeframe. The cryptocurrency has increased by 50% in the past week. KSM crypto has been on a straight upward trajectory since 28th May. At the time of writing, Kusama stands at a price level of $467. The price has increased by 22% in the past twenty-four hours while the daily trading volume has increased by 66%. The sharp increase in the cryptocurrency can be accorded to the Polkadot parachain launch on Kusama and it can be expected to continue increasing as the parachains launch.

    Kusama (KSM) Technical Analysis

    The market sentiment for Kusama is bullish. Out of the twenty-six technical indicators, fifteen are giving out a signal of buy with ten standing on a neutral position and only one indicator giving out a sell signal. Overall, the oscillators are neutral while the moving averages suggest a strong uptrend.

    Kusama (KSM) Technical Analysis
    Kusama (KSM) Technical Analysis

    A trader has identified Kusama (KSM) crypto in an ascending channel formation. KSM crypto touched the lower boundary of the channel amidst the market crash but has now entered a safe zone. Kusama is nearing a break out from the zone which will validate the uptrend. Kusama will be facing strong resistance at $560 – a level it has faced multiple rejections from. If Kusama is rejected once again at the resistance level, it may drop to as low as $400. However, in the long-term window, Kusama is expected to rise once again. The trader has set an optimistic price target of $1,683 for the cryptocurrency.

    Kusama (KSM) price prediction

    Wallet Investor predicts the cryptocurrency at a price level of $1,140 in one year’s time while the five-year forecast places it at $4,465. Digital Coin Price’s projections state Kusama will end the year with a price of $716 but continue increasing to $2,104 in five years’ time.

    Given the technical analysis and price predictions for Kusama, it can be expected that the future has good things in store for the cryptocurrency. The parachain launch will definitely boost the value of Kusama by many folds.

  • Binance Coin (BNB) bullish momentum – Towards $544

    Binance Coin (BNB) bullish momentum – Towards $544

    Binance Coin (BNB) has increased nearly 13% in the past week. The cryptocurrency has effectively reversed its downward trajectory – although the price movements are highly volatile ever since the market crash, hinting towards uncertainty in the market. At the time of writing, BNB coin stands at a price level of $397. The price of BNB crypto has increased by 11% in the past twenty-four hours while the daily trading volume has shot up by 37%.

    Binance Coin (BNB) Technical Analysis

    The market sentiment for Binance Coin is neutral per the technical indicators. Out of the twenty-six technical indicators, ten are giving out a signal of buy nine are standing at a neutral position while seven are suggesting sell position. Both the oscillators and moving averages are neutral. The technical also suggest uncertainty in the market which could lead to even more volatility.

    Binance Coin (BNB) Technical Analysis
    Binance Coin (BNB) Technical Analysis

    A trader has identified a possible trajectory for Binance Coin. Per the analysis, Binance crypto was expected to stay stuck in the price level below $280 because of high bearish divergence; however, Binance Coin quickly regained bullish momentum and broke out of the resistance zone. Potential price targets have been identified to lie at the price level of $483 followed by $544. Binance Coin has shown good growth after the crash with no reason that the cryptocurrency may not continue the upward trend.

    Binance Coin (BNB) price prediction

    Trading Beasts’ projections for the future are not in the favour of the coin. The projections show Binnace Coin’s price to decline by the end of the year to $366 while the average price for 2024 is expected to be $661. However, Wallet investor predicts $600 in a year’s time while the 5-year forecast show a staggering price level at $2007. Digital Coin Price is also bullish on the cryptocurrency and projects a similar price of $617 by 2021 and $1747 by 2028.

  • Tron (TRX) coin downward trend to be reversed soon?

    Tron (TRX) coin downward trend to be reversed soon?

    Tron (TRX) could not break its all-time high of $0.30 established in the 2018 bull run. The cryptocurrency did manage a 52-week high of $0.17 in the bull run of 2021 after which it fell to a low of $0.06 amidst the market crash. At the time of writing, Tron crypto stands at a price level of $0.075. The cryptocurrency appears to be slowly recovering from the brutal crash of the market. The price of TRX coin has been declining in the past twenty-four hours while the daily trading volume has increased by 31%.

    Tron (TRX) Technical Analysis

    The market is yet to recover; hence, the overall sentiment still remains largely bearish. The market outlook for Tron crypto is also bearish. Out of the total twenty-six technical indicators, eleven are giving out a signal of the sell while ten stand at a neutral position and only five indicators are signaling a buy. The oscillators are mainly neutral while the moving averages suggest a strong fall in the price of the cryptocurrency.

    Tron (TRX) Technical Analysis
    Tron (TRX) Technical Analysis

    TRX coin is expected to be on a strong pullback. A trader’s analysis explains Tron cryptocurrency’s downward trend as a pullback that is not to last. The price level of $0.56 is identified as strong support where Tron crypto can stabilize. After skirting near the support level, Tron may embark on an upward trend. In the long-term window, if the situation plays out like this, then the trader is expecting the price target at $3 to be activated. Although, Tron cryptocurrency will be facing a nearby resistance at $0.5. The short-term scenario may vary.

    Tron (TRX) Price Prediction

    The price prediction of $3 may be too optimistic at the moment. Wallet Investor’s projections place the cryptocurrency near $0.5 in five years’ time. While Digital Coin Price is not bullish on the TRX coin and suggest a price level of $0.3 in five years. The upcoming price action will reveal if Tron can develop to $0.5 in the long-term window.

  • Aave (AAVE) coin to test support level soon?

    Aave (AAVE) coin to test support level soon?

    Aave (AAVE) peaked at $648 in the bull run of 2021. The cryptocurrency fell to a 7-day low of $210 as the market crashed but the downturn appears to have been reversed. At the time of press, Aave crypto stands at a price level of $361. However, the price has been declining the twenty-four-hour timeframe. The daily trading volume has also decreased by 30%.

    Aave (AAVE) Technical Analysis

    The market sentiment for AAVE coin is bearish. Out of the twenty-six technical indicators, fourteen are giving out a signal of the sell while ten stand at a neutral position and only two indications suggest a buy. Both the oscillators and moving averages are bearish suggesting a downtrend in the cryptocurrency that may likely persist.

    Aave (AAVE) Technical Analysis
    Aave (AAVE) Technical Analysis

    Aave coin had picked up bullish momentum after the low of the market crash was established but the momentum could not be maintained, unfortunately. The recent price actions show bearish one-day candles being formed. The Bollinger Bands reveal high volatility in the market which, as per theory, suggests no explosive moves to be expected from Aave crypto in the coming days. Aave coin is on a downtrend and; hence, can be expected to test the support level which lies at $315. The support levels had been tested nearly four times in the past and it held up even after a break for some time.

    What is Aave (AAVE)?

    Aave is a decentralized lending protocol where users can lend or borrow cryptocurrency without any centralized authority’s oversight. Instead of traditional finance, where intermediaries and centralized authorities are crucial, DeFi uses smart contracts to automate the tasks. What makes Aave special is that it is one of the largest lenders in the market with a capitalization far more than other competitors like Maker.

  • Ethereum Classic (ETC): Will the bearish divergence rise?

    Ethereum Classic (ETC): Will the bearish divergence rise?

    Ethereum Classic (ETC) has had 1,200% returns year-to-date. The cryptocurrency rose to prominence amidst the market boom of 2021. Before the start of the year, ETC coin was operating at a price level of $5 and went as high as $176. At the time of writing, ETC crypto stands at a price level of $74. The price of cryptocurrency is on a downtrend. The price level decreased by 8% in the past twenty-four hours while the daily trading volume went down by 30%.

    Ethereum Classic (ETC) Technical Analysis

    The market sentiment for Ethereum Classic is neutral with a bearish bias. Out of the twenty-six technical indicators, ten stand at a neutral position while buy and sell indications are at eight each. The oscillators are bearish while the moving averages suggest an uptrend.

    Ethereum Classic (ETC) Technical Analysis
    Ethereum Classic (ETC) Technical Analysis

    After picking up the pace, Ethereum Classic again succumbed to the bearish pressure in the market. The cryptocurrency was operating in a descending channel formation after establishing its all-time high. The recent bullish momentum resulted in ETC crypto breaking out of the formation to the upside. However, the bullish divergence could not be upheld as Ethereum Classic again fell downwards. The price level of $72 is acting as strong support for the cryptocurrency while the price level of $80 followed by $84 are major resistance levels which ETC coin has failed to break.

    Why Ethereum Classic (ETC) can go up?

    According to the forecast of Digital Coin Price Ethereum Classic will stand at a price level of $330 in five years’ time but why? Ethereum Classic is a hard fork of Ethereum which means it has the capabilities of the queen of the market but is a better alternative. Ethereum’s potential is a hard fact now because of the unique offering of the platform.

    Ethereum Classic was a product of the 2016 hack. The developers believe the coin to be “free from external interference and subjective tampering” – making it more secure. ETC has outperformed ETH in the bull run in terms of price growth. The stark difference in the price of both cryptocurrencies also make ETC more viable than ETH. While the technical analysis may suggest a prolonger bearish bias, the fundamentals are strong and some advocates believe ETC may overtake ETH one day – which may be wishful thinking but the crypto market is full of surprises.

  • Neo (NEO) coin nearing strong resistance at $77

    Neo (NEO) coin nearing strong resistance at $77

    Neo (NEO) stands at a price level of $58, at the time of writing. During the bull run of 2021, NEO coin could not break its all-time high of $196 established during 2018. It did, however, reach towards $140 as its 52-week high. The cryptocurrency has fallen nearly 60% from its high of the 2021 bull run. In the daily timeframe, Neo coin appears to be continuing its downward trend with the price decreasing since the past day. The daily trading volume is also on a downtrend.

    Neo (NEO) Technical Analysis

    The market sentiment for Neo crypto is bearish – as is a majority of the crypto market. On a downward bias, technical indicators for the cryptocurrency are majorly suggesting sell signals. Out of the twenty-six on-site technical indicators, twelve suggest a sell, ten are standing at a neutral position while only four are giving out a buy signal. The oscillators are neutral while the moving averages are suggesting a strong fall in the price level.

    Neo coin is expected to soon reverse its downward trajectory. A trader has identified the price level of $35 as strong support. The cryptocurrency experienced a pullback from the support level amidst the market crash – indicating its strength. The trader has also identified strong resistance lying at $77 which stands parallel to the 0.618 Fibonacci retracement level. The cryptocurrency will see 48% growth if it is able to reach towards the resistance level and stabilize in the region.

    Evolution of Neo blockchain: N3

    N3 is a version of the Neo blockchain said to represent “bold, refined, simple and powerful”, It is the next step in the evolution of the Neo blockchain which will take it closer to Neo’s mission of becoming the most complete blockchain available. N3 is not to be confused with a newer blockchain but rather it is a newer upgrade for the Neo blockchain. It will be launched on a new chain resulting in two versions of blockchain running simultaneously. The N3 may be the stepping stone in the journey of the Neo blockchain.

  • Chainlink (LINK) coin upcoming resistance at $36

    Chainlink (LINK) coin upcoming resistance at $36

    Chainlink (LINK) established its all-time high at $52.88 in the beginning of the month. However, the growth of the cryptocurrency was nearly reversed as it fell to a low of $20 in the market crash. Chainlink crypto has shown some bullish momentum in the recent price movements. At the time of writing, Chainlink crypto stands at a price level of $31. The price of the coin has increased by 20% since the past day while the daily trading volume is also on the rise.

    Chainlink (LINK) Technical Analysis

    The market sentiment for Chainlink is bearish as is the whole cryptocurrency market. A majority of the technical indicators are suggesting the bearish trend to continue. Out of the total twenty-six technical indicators, ten are giving out a sell signal while ten are standing at a neutral position and six are indicating a buy signal. The oscillators are mainly neutral while the moving averages suggest a downtrend.

    Chainlink (LINK) Technical Analysis
    Chainlink (LINK) Technical Analysis

    As Chainlink crypto has picked up bullish momentum, the cryptocurrency is near various important resistance and support levels. LINK coin had tested the Fibonacci support level at $18 from where it rebounded to the upside. Currently, the cryptocurrency has broken the resistance level at $30 which lies parallel to the Fibonacci level of 0.5. The next resistance is lying at the 0.382 Fibonacci level which lies parallel to the price level of $36, followed by $42 at 0.236 Fibonacci retracement level. Chainlink is also being supported by the Fibonacci level of 0.618 at the price of $25.5. Overall, the recent candles on the daily timeframes are bullish so Chainlink may be expected to go upwards.

    What is Chainlink?

    Chainlink (LINK) had gained increasing popularity in the bull run of 2021 and it is believed to be one of the projects that may become crucial to the blockchain ecosystem in the coming days because of its offering. Chainlink is primarily a decentralized oracle provider. The network provides crucial data to the blockchain by employing smart contracts.

  • Kusama (KSM) coin renewed bullish momentum

    Kusama (KSM) coin renewed bullish momentum

    Kusama (KSM) peaked at $594 in the bull run. As the crypto market crashes, Kusama coin fell to a low of $262. However, as the market cooled down KSM crypto began showing signs of bullish movement again. At the time of writing, Kusama stands at a price level of $339. The price of the cryptocurrency has been going upwards in the past twenty-four hours while the daily trading volume has declined by 20%.

    Kusama (KSM) Technical Analysis

    Despite the slightly bullish moment, the market sentiment for Kusama is largely bearish. Out of the twenty-six technical indicators thirteen are giving out a sell signal, nine are standing at a neutral position while only four are indicating towards buy. The oscillators are majorly neutral while the moving averages are bearish.

    Kusama (KSM) Technical Analysis
    Kusama (KSM) Technical Analysis

    Kusama (KSM) is identified to be still operating in an upward channel formation in the longer timeframes. The cryptocurrency broke out of the channel to the upside during the peak of the bull run but has stayed inside the channel since August 2020. The brutal market correction also did not result in a downside break out – hinting the lower boundary to be acting as a strong support.

    What is Kusama (KSM)?

    Kusama is cited as Polkadot’s “Wild Cousin”. The Kusama blockchain runs in parallel with Polkadot’s like a parachain would but it is not a parachain. It is Polkadot’s canary network and serves as a testing ground for projects that are to be deployed on Polkadot.

    Kusama and Polkadot are launching their parachain auction which is also the last phase of the Polkadot blockchain. Parachains are layer-1 solutions that will run in parallel will Polkadot and Kusama. The parachain auction is a hallmark step in the interoperability of blockchains and may push both the networks ahead.