Tag: Technical Analysis

  • Cardano (ADA) fighting the bears with multiple support levels

    Cardano (ADA) fighting the bears with multiple support levels

    Cardano (ADA) has been surging. Cardano coin has been on a steep upward trend since the beginning of May – adding to the bullish momentum. The cryptocurrency established a new all-time high at $1.83 a few days ago. At the time of writing, Cardano coin stands at a price level of $1.77. The price of the cryptocurrency has increased by 6% in the past twenty-four hours while the daily trading volume has decreased by 15%. Cardano crypto is ranked sixth in the market with a capitalization of $56 billion.

    Cardano (ADA) technical analysis


    The market sentiment for the cryptocurrency is bullish. Out of the total technical indicators, fifteen stand at a buy position while nine are giving out a neutral signal and only two are standing at a sell position. The oscillators are mainly neutral while the moving averages are bullish.

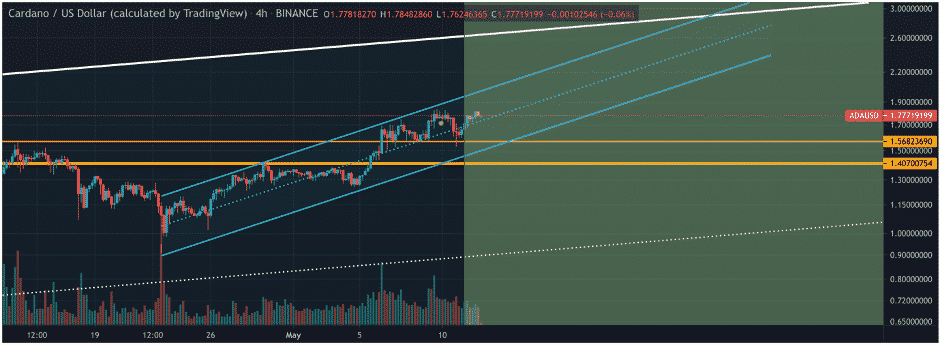
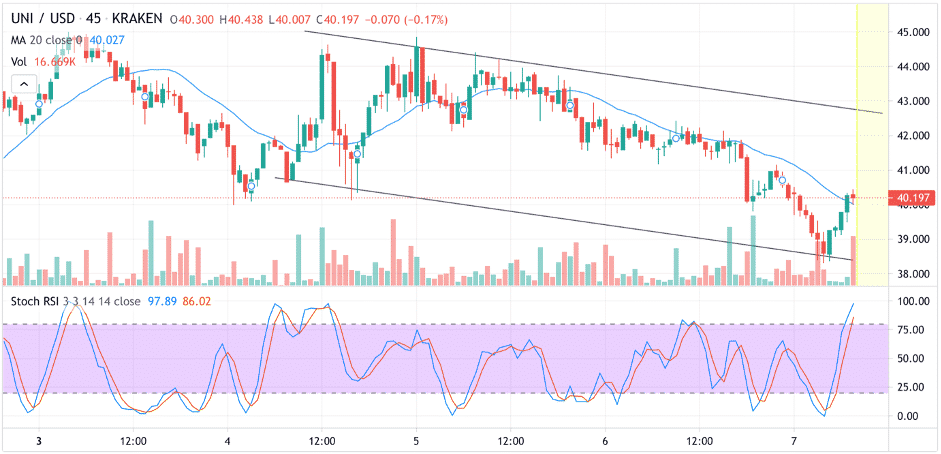
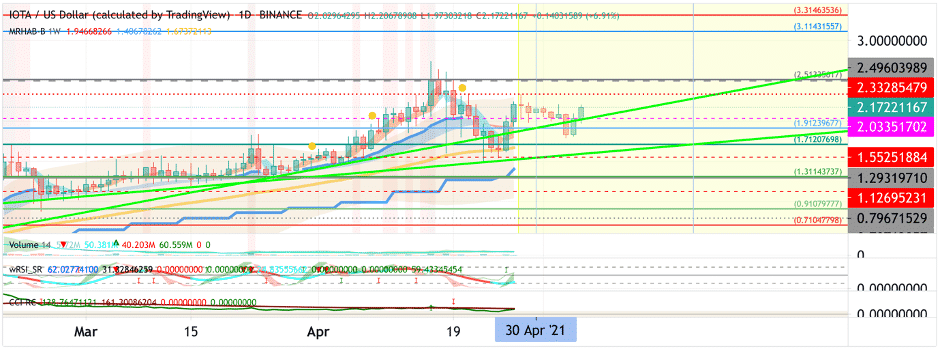
    A trader has identified Cardano crypto in an ascending channel formation. The channel had begun forming since the end of April and Cardano has been operating inside the channel ever since. An ascending support line has also been identified which dissects the channel in half. Cardano coin’s market outlook had turned bearish as the cryptocurrency fell below the support line inside the channel. However, it has ever since established the support level again as it stabilized in the level. Cardano is also facing support at $1.56 and $1.40. Per the trader, the renewed bullish momentum is the market will lead it towards higher highs.

    Why is Cardano (ADA) bullish?

    The organization behind Cardano, IOHK, is working tirelessly on the real-world uses of the cryptocurrency. Data from Google Trends show that interest in Cardano had begun rising since the end of January and peaked in middle of March. A further break down reveals that country-wise, Australia, Netherlands and Ireland have accounted for most of the interest in the cryptocurrency.

    IOHK has also announced a partnership in Africa. IOHK is working with the ministry of education in Ethiopia to roll out a blockchain-based student performance tracking system. The program will initially be launched for 5 million students and 750,000 teachers. This is a hallmark moment for not just Cardano but the cryptocurrency sphere as the project marks the world’s biggest blockchain deployment.

  • Chainlink (LINK) price developments: What to expect?

    Chainlink (LINK) price developments: What to expect?

    Chainlink (LINK) has been amidst strong bullish momentum after the cryptocurrency succumbed to bearish pressures. The surging Chainlink coin established a new all-time high at $52. At the time of publication, Chainlink was trading hands at a price of $51 apiece. The price of the cryptocurrency has increased by 6% in the daily chart while the daily trading volume of Chainlink has gone up by 60%. The decentralized oracle service has proven to be an integral part of the cryptocurrency sphere.

    Chainlink (LINK) technical analysis

    The market sentiment for Chainlink is bullish. Fourteen of the twenty-six technical indicators are giving out a signal of buy with seven standing at a neutral position. Five of the remaining indicators are giving out a signal of sell. The oscillators are bearish with an overall indication of sell while the moving averages are bullish with an overall indication of strong buy.

    A trader has identified Chainlink crypto to have formed a coherent wave count. Per the trader’s analysis, Chainlink has completed the formation of all five waves, portraying strong up and down volatility. While forming the wave count, LINK coin has also established various support levels which are crucial for the cryptocurrency to hold. Currently, Chainlink is on an upside move – an extension of the fifth wave. However, bearish momentum may soon overtake the market as minor retracements usually follow after impulsive moves. In that case, the price level of $46 will prove to be a strong support for Chainlink.

    Chainlink (LINK) price prediction

    Trading Beasts is projecting a gradual increase in the price of Chainlink over the years. The upward trend will result in Chainlink having a price of $61 by the end of 2024. The 2021 predictions for Chainlink are bearish with the year ending at $38. Digital Coin Price predicts Chainlink crypto will end the year with a value of $76 while it is expected to climb up towards $224 by 2028. Wallet Investor has issued a one-year prediction at a price level of $671 with the five-year prediction at $2332

  • Solana (SOL) in bullish mode thanks to recent developments

    Solana (SOL) in bullish mode thanks to recent developments

    Solana (SOL) stands at a price level of $45, at the time of press. The price of Solana coin has been increasing in the past twenty-four hours while the daily trading volume has fallen 30%. The permission-less blockchain-based on providing decentralized finance solution has been surging amidst the DeFi craze. SOL coin established its all-time high at $49 a week ago. Currently, the cryptocurrency is ranked seventeenth in terms of capitalization in the market.

    Solana (SOL) technical analysis

    The market sentiment for Solana is bullish with fifteen of the twenty-six technical indicators giving out a signal of buy. Out of the rest, ten indicators are standing at a neutral position with just one indication of sell. The oscillators are neutral while the moving averages are strongly bullish.

    A trader has identified Solana crypto in an ascending channel formation. The channel has been under formation since February while the bullish trend of Solana has now been continued for a fifth month on the logarithmic view. The trader has also pointed out towards a flag formation inside the channel. The flag formation makes the price level of $43 as strong support for the cryptocurrency. If Solana is able to hold the support level, there is a good chance of an upward break out from the channel which will lead to higher highs for SOL coin.

    Why is Solana (SOL) bullish?

    ChainSwap the cross-chain bridge has partnered with the Solana-based automated market maker and liquidity provided Raydium. The partnership will enable ChainSwap towards a bridge from Solana to EVM. The union will also increase the capabilities of Raydium by allowing liquidity creation on the platform.  The developments are said to lead the way towards the evolution of decentralized finance by leveraging the power of Solana blockchain.

  • Litecoin (LTC) new ATH – What to expect?

    Litecoin (LTC) new ATH – What to expect?

    Litecoin (LTC) has been surging. The cryptocurrency finally broke its all-time high of 2018 by establishing a new ATH at $412. At the time of writing, LTC crypto stands at a price level of $402. The price has increased by 15% in the past twenty-four hours while the daily trading volume has surged up by nearly 100%. Litecoin (LTC) is showing increased bullish divergence which can lead the coin even higher. Litecoin has had almost 550% gains in the yearly timeframe. The crypto has been regarded as the relatively stable one but that may be reversed given its recent surge.

    Litecoin (LTC) technical analysis

    The market sentiment for LTC coin is bullish. Out of the 26 technical indicators, sixteen stand at a position of buy while seven are standing at a neutral position with just three indications of sell. The oscillators are neutral while the moving averages are strongly bullish.

    A trader has set a price target of $450 followed by $500 for Litecoin in his price prediction. The trader has identified various crucial levels for the cryptocurrency which hints towards increased bullish divergence. The trader has identified the price level of $355 as crucial support level. If LTC crypto falls below the level it can enter a support zone in the hopes of stabilization but the fall would entail the rising pressure of the bears. A green zone lies above the price level of $355. The green zone is a signal of strong bullish divergence which could ultimately lead LTC coin towards the set price targets.

    Litecoin (LTC) price prediction

    Trading beasts’ forecasts are not bullish on the cryptocurrency and suggests a price of $260 by the end of the year. However, Wallet Investor has validated the price target of $450 as it is the value expected for LTC coin by the end of 2021. The 5-year forecast places Litecoin at a price level of nearly $700. Digital Coin Price is predicting Litecoin to have a price of $585 in 2021 while the 5-year projection shows Litecoin at $1,838.

  • Filecoin (FIL) may break resistance at $175

    Filecoin (FIL) may break resistance at $175

    Filecoin (FIL) has been amidst market corrections since the end of March when it established its all-time high at $237. The cryptocurrency has had upside pullbacks ever since but none as effective to completely lift it out of the market retracements. At the time of writing, Filecoin is trading hands $151 apiece. The price of the cryptocurrency has fallen by 4% in the past twenty-four hours while the trading volume has declines by 15%. Filecoin currently stands at twenty-one in the market. Filecoin crypto has had a brief period as the top ten cryptocurrencies in the market during its bullish momentum.

    Filecoin (FIL) technical analysis

    The market sentiment for FIL is bullish. Out of the twenty-six technical indicators, ten stand at a neutral position while nine are giving out a signal of buy with just five indications of sell. The oscillators re neutral while the moving averages are strongly bullish.

    A trader has identified Filecoin to be operating in a triangular formation. FIL crypto had begun forming the triangle since April. The trader is waiting for a break out confirmation from the formation in order to validate the target price set for Filecoin. Per the trader the price level of $175 is a strong resistance level for FIL crypto and the next price target. The resistance level has been firmed through the historical price action of FIL coin. If FIL crypto is able to break out of the triangle, then it can be expected to reach towards $175.

    What is Filecoin (FIL)?

    Filecoin is a decentralized storage platform utilizing the blockchain technology. Cloud storage platforms like Amazon have been facing problems because of centralization. The decentralization of Filecoin provides numerous benefits over centralized cloud storages like better security and efficiency.

  • Uniswap (UNI): Heading towards resistance level?

    Uniswap (UNI): Heading towards resistance level?

    Uniswap (UNI) has been hit by market corrections after the cryptocurrency established an all-time high at $44.97. At the time of press, Uniswap stands at a price level of $40.25. The price of UNI coin has fallen by 3% in the past twenty-four hours while the daily trading volume is on a slow rise. Ranked eleventh in the market, the capitalization of the cryptocurrency has also fallen in lieu with the price.

    Uniswap (UNI) technical analysis

    The technical indicators are giving out a buy signal for Uniswap – indicating towards a bullish sentiment in the market. Out of the twenty-six technical indicators, ten bare standing at a neutral position while twelve are giving out a buy signal with only four indications of sell. The oscillators are neutral while the moving averages are strongly bullish.

    In the 45 minutes timeframe, Uniswap has been identified to be operating in a descending channel formation. The descending upper boundary is acting as strong resistance for UNI coin while the lower boundary has been established as strong support. Uniswap has retested the support at the lower boundary and it had held. After falling lower than the 20-day Moving Average and with the 20-MA acting as resistance, UNI coin has, once again, gone above the MA level. Keeping the upward movement in mind, UNI crypto may retest the resistance level at around $43 – or at least head towards that level.

    Could Uniswap break its ATH?

    The recent bullish trend in Uniswap’s market can be accorded to the launch of the V3 update. The V3 was the most anticipated upgrade of the decentralized exchange. The most powerful version to date, V3, provides increased capital efficiency and better infrastructure for traders.

    While the V2 protocol is still live on Ethereum’s blockchain, it is expected that eventually majority of the users will migrate to V3. In just two days after its launch, users have registered complaints primarily about the high gas fees. However, it has also been reported that the V3 has processed more than double the volume that V2 did in its first month. The newer version of the Ethereum-powered automated market maker can take it to newer highs.

  • IOTA (MIOTA) technical analysis: Major resistance upcoming 

    IOTA (MIOTA) technical analysis: Major resistance upcoming 

    IOTA (MIOTA) stands at a price level of $2.14, at the time of press. IOTA coin has been up by 10% in the past twenty-four hours while the daily trading volume has also increased by 13%. In the current bullrun, the cryptocurrency was able to establish its 52-week high at $2.68 while the all-time high of 2018 at $5.69 remains untouched. Iota suffered from market corrections after the 52-week high was established but the coin may appear to have picked up bullish momentum, once again. Iota coin is ranked at twenty-nineth in the market with the capitalization increasing by 10%.

    IOTA technical analysis

    Iota coin has been following as uptrend identified by a trader since early March. Iota has been surging amidst the bull run of the new year and has been one of the well performing cryptocurrencies.

    Per the trader, Iota coin is facing strong resistance at the price level of $2.49. The cryptocurrency have had multiple rejections at the price level and acting as a major resistance, breaking it would indicate increased bullish momentum of the coin. During pullbacks, Iota has also broken out of the trend line but it ultimately reaches back above the ascending trendline – indicting it to be strong support.

    According to Wallet Investor, Iota coin is going to be valued at $2.70 by the end of the year while Digital Coin price has set the target of $3.3 for the year end. It is likely then that the coin will break the major resistance at $2.49 by the end of the year.

    What is IOTA?

    IOTA may be considered as the next stage in the cryptocurrency sphere. It is a distributed ledger but it’s not a blockchain. As appealing as the blockchain technology is, it certainly has its limitation. Iota is a propriety technology known as Tangle. As it is not a blockchain, Iota does not have any miner and, hence, any fees. The foundation behind the technology says Iota offers much higher speed than conventional blockchains. The goal of the platform is to become the network for IoT transactions between devices.

  • Bitcoin Cash (BCH) price prediction: Towards $1,700?

    Bitcoin Cash (BCH) price prediction: Towards $1,700?

    Bitcoin Cash (BCH) has been surging – establishing higher highs and higher lows. However, BCH coin has not been able to cross its all-time high of $4,355 established in 2018. The cryptocurrency has established its 52-week high at $1,474 in the current bull run. At the time of writing, Bitcoin Cash stands at a price level of $1,323. The price of BCH coin has gone up by 20% in the past twenty-four hours while the daily trading volume has surged upwards by 100%. Ranked eighth in the market, the capitalization of the coin is also increasing.

    Bitcoin Cash (BCH) technical analysis

    The market sentiment for BCH coin is bullish. Out of the 26 technical indicators, fifteen are giving out a signal of buy while eight are standing at a neutral position and three are giving out a sell signal. The oscillators are bearish while the moving averages are neutral.

    A trader is expecting minor pullbacks from BCH coin in his Bitcoin Cash analysis. After an upward move, the trader expects Bitcoin Cash will fall to $860 for the market to cool down. However, the support zone is expected to stabilize the coin so it does not fall lower. After the minor retracements, Bitcoin Cash is expected to continue its upward move. The trader has set a price target of $1,700 for BCH coin. Per the trader, Bitcoin Cash has been accumulating for the last nine months and it is just the beginning for the coin.

    Bitcoin Cash (BCH) price prediction

    Wallet Investor is not bullish on the one of the most successful hard forks. The predictions place Bitcoin Cash on a downward trend in the yearly timeframe with the price dropping to $1,173. However, the five-year estimates predict Bitcoin Cash at $1,703. On the other hand, Digital Coin Price places BCH coin at $1,907 by the end of the year with an extremely bullish five-year prediction of nearly $6,000 after five years.

  • Ethereum (ETH) under the bulls – What to expect?

    Ethereum (ETH) under the bulls – What to expect?

    Ethereum (ETH) is on a steep uptrend. The altcoin season has been favorable for the queen of the market. Ethereum established its all-time high at $3,541 hours ago from the time of press. At the time of writing, ETH coin stands at a price level of $3,409 with the price climbing up 5% in the daily timeframe. The daily trading volume for the cryptocurrency, however, has declined. Second only to Bitcoin, the market capitalization of Ethereum has been climbing steadily – now standing at $395 billion.

    Ethereum (ETH) technical analysis

    The market sentiment for Ethereum is strongly bullish. Out of the 26 total technical indicators, fifteen are standing at a buy position with six at neutral position and only five giving out a sell signal. The oscillators are mainly bearish – indicating a sell signal – while the moving averages are bullish.

    A trader has identified Ethereum to have formed multiple wave counts in their ETH price analysis. Per the trader, the cryptocurrency is currently developing two distinct wave counts. The third wave of the more volatile wave count is under development. At the third wave, Ethereum is expected to retest its resistance level at the 1.618 Fibonacci Retracement which lies parallel to the price level $3,688. A minor pullback is likely to occur after failure in retesting the resistance level but Ethereum will reach forward afterwards.

    Why is Ethereum bullish?

    ETH coin was able to cross the psychological resistance level of $3,000 all because of a strong bullish sentiment in the market. The confidence in the cryptocurrency and its technology is growing as the anticipated upgrade, ETH2.0, looms closer. ETH 2.0 is said to be game changer as it will shift the cryptocurrency from a proof of work mechanism to a proof of stake one. The update will drastically improve the scalability of Ethereum and is the primary reason why the confidence in the cryptocurrency is growing at such a pace.

  • Maker (MKR) price prediction: Advancing towards $10,000?

    Maker (MKR) price prediction: Advancing towards $10,000?

    Maker (MKR) cryptocurrency has been surging in the 2021 bull run. Maker coin establishes its new all-time high at $6,339. At the time of writing, Maker (MKR) stands at a price level of $5,234. The price has fallen by 8% in daily timeframe while the daily trading volume has also dropped by 40%. Ranked at 33 in the market, the capitalization of MKR coin has decreased by 10%.

    Maker (MKR) technical analysis

    The technical indicators for the cryptocurrency are giving out a neutral signal, indicating uncertainty in the market. Out of the 26 total technical indicators, fifteen are giving out a signal of buy with nine at neutral position and only two indicators at a sell position. The oscillators are neutral while the moving averages are strongly bullish.

    A trader has identified a straight upward trend for Maker (MKR) crypto. Per the trader, Maker crypto has successfully established various support zones that may propel the cryptocurrency upwards. The first strong support level lies at $4,951 followed by $4,972 and others. The trader has also set a very optimistic price target for Maker coin at a price level of $10,000.

    Maker (MKR) price prediction

    Wallet Investor’s one year price projection puts the price of Maker crypto at $8,033 while in five years’ time Maker is expected to be priced at a staggering $19,077. Digital Coin Price predicts Maker coin will end the year at a price of $7,704 while by 2028 the cryptocurrency will be valued at a whopping 24,398.

    Why is Maker (MKR) bullish?

    Maker Foundation, the organization responsible for making the protocol completely decentralized, believes its work to be done. The Foundation is set to cease existing by the end of the year – handing over the reins of the protocol completely to the community. The organization recently also sent 84,000 MRK tokens worth $480 million to the protocol which is community is responsible for.

    The Maker Protocol is tasked with issuing the DAI stablecoin and is based on the blockchain of Ethereum. The DeFi surge has contributed in the rise of the platform and it token, MKR. With a total value locked at $11.09 billion, it is the number one ranked Ethereum-based DeFi platform in terms of TVL.