Tag: Technical Analysis

  • Hedera Hashgraph (HBAR) – Recent Price Action

    Hedera Hashgraph (HBAR) – Recent Price Action

    According to the market cap, the entire quantity of HBAR is around 50 billion, with less than half of it, or 18 billion, now in circulation. With a market share of almost 0.25 percent, it is placed seventh in terms of market capitalization.

    HBAR is presently selling at $0.2417 per coin, a rise of roughly 11.81 percent in a single day. The high and low for today are $0.246 and $0.2157, respectively. On the other hand, daily trading volume has increased by more than 238 percent. HBAR reached an all-time high of about $0.576 in September 2021. During the dip, the price dropped to around $0.18 in January 2021. The price began to fall, although, like many other coins, the reversal was relatively feeble. In general, the price is making higher highs and higher lows. The price of HBAR increased by over 9.16 percent in February.

    Technical Analysis – HEDERA HASHGRAPH (HBAR)

    HBAR has been on the bullish coins at one time. A few months back, we had seen huge gains in the price of HBAR and it was continuously increasing in price. But the drop in the price hit it hard and we saw serious drops in the price. Now being traded at a fraction of what its all-time high value was.

    HBAR - 4H

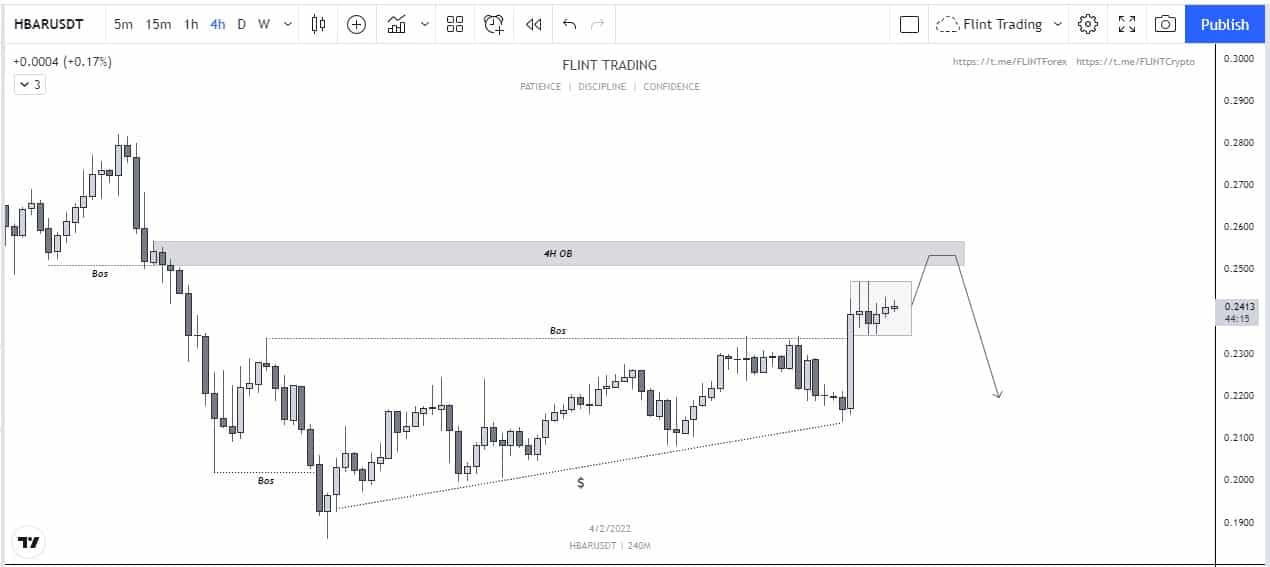
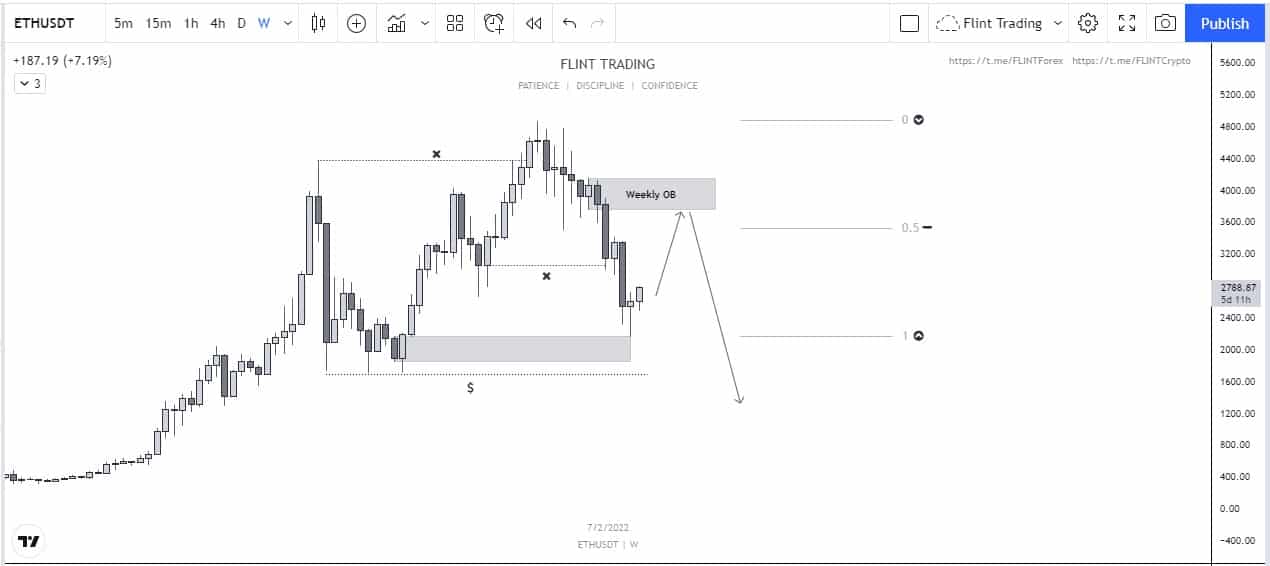
    Now the recent price action of HBAR is very bearish in nature until proven otherwise. We can see that the price started to create higher highs and higher lows. but it can be looked at as an ascending correction. Different confluences are present. First is the unmitigated order block that is present above the current price. This can drive the price upwards from where a reaction can be expected. Second is the equal highs that the wicks have formed. Following the AMD pattern, we can expect a rejection from this level.

    Price Prediction – HEDERA HASHGRAPH (HBAR)

    HBAR is a terrific investment that will bring excellent rewards. HBAR is also seen as an excellent investment by Digital Coin Price. They predict that in a year’s time, the price would rise to $0.38. The price is predicted to reach $1.04 in seven years. The price is predicted to reach an all-time high in a year, but they believe that a long-term hold is extremely rewarding. Traders, like them, are positive about the price trend and believe it will retain much more value in the near future.

  • GALA – How can the price React now?

    GALA – How can the price React now?

    Moving to the technical side, starting from the weekly time frame, the price has just formed a double top and has just completed its second top. Now this pattern according to the textbook shows bearish pressure. Talking about the volume and momentum, the bearish momentum is very strong at the moment. It is very likely that it pushes more, but the zone it is in right now can stop the momentum as well, as that’s a weekly Order Block.

    Moreover, The last week was closed bullish which showed a reaction to that order block. So considering the number of buyers interested there, it can be observed that the price might reject more for some time. Moreover talking about that previous double top pattern, the price is at the neckline of that pattern. This does offer support to the price and can show support this time as well as it lies within a confluence of that weekly Order Block.

    Moving down to the daily time frame, the price is created Lower Lows and Lower Highs and right now it possibly could have created a lower high or maybe not. Now as there is some liquidity and imbalance present upside which can drive the price upwards to fill the imbalance and clear the liquidity.

    GALA - 1D

    Lower Time Frame – GALA

    Moving down to the 4 Hour Time Frame, the price has shown bullish order flow. As the price is very clearly breaking structure to the upside. When the price was pushing downside, it left an imbalance along the way which this bullish move is trying to fill. The price moreover is around in a demand area and a very strong one. As in the past, the price got some great bullish volume in the market. Some bulls might be interested to enter into that. The price has already been rejected off that level like 2 times.

    It’s very possible that this rejection may induce more buyers in the market which then can push the price to the upside. Talking about the targets the level of $0.087 is a great one as that is a supply zone. A lot of bears entered the market from that level. The first target can be considered as the level of $0.0783 as that is an order block as well. Talking about the invalidation if the price violates the level of $0.06592, then this whole scenario would get invalidated.

  • IDEX Coin  – Where will the Price Move Now?

    IDEX Coin – Where will the Price Move Now?

    At the time of writing, IDEX is being traded at the rate of $0.1965 with an increase of almost 66.53% within the last 24 hours. It is one of the top gainers on Binance.

    The low within this tenure was around $0.2246 and the high was approximately $0.1177. The coin as being in the watchlist of many traders makes it rank all the way up to number 333th according to the latest data released by coin market cap.

    IDEX made its all-time high in the month of September 2021 when it reached an enormous amount of $1.69. At the moment it has a daily volume of $231,825,820 with an increase of about 1508% within the last 24 hours. The total supply of IDEX is now around 1B and the circulating supply is also 635M. The top exchanges for trading it are currently Binance, Huobi Global, Mandala Exchange.

    Technical Analysis

    IDEX has been one of the bearish coins in the past. The price had been continuously decreasing since its launch. Now the price has shown strength and we have seen huge momentum after the Asian time zone came.

    Now during the creation of the bottom of the price, IDEX created a supply zone that remained unmitigated for a long time. On the 4H time frame, we can see that the price continued to drop down from that level but eventually showed signs of reversal and went on to print a gigantic green candle.

    IDEX - 4H

    Now the price of IDEX is at an indecisive area. It is near the supply zone that caused the drop. If the price can stay above this area we can look for a long position at the price. If the price fails to hold then we look for a short position which would drop it down to the imbalance present below.

    Price Prediction – IDEX

    IDEX has had a very beautiful start during the month of September 2021. The price touched its all-time high on 9th September but after that, the price continued to drop down and we saw a continued decrease in the price. Today even though the price has increased by 66% but it’s far from its all-time high.

    According to wallet investor the price is to reach a value of $0.344 in one year. In five years, the price is expected to reach a value of $1.234.

  • Verasity (VRA) – Will we see Momentum Soon?

    Verasity (VRA) – Will we see Momentum Soon?

    Moving to the technical portion, starting from the weekly, the price behavior is very clear and is showing a lot of signs. The price was breaking structures to the upside, but recently it broke structure to the downside which resulted in a change of character. Now the overall structure edge is to the downside. Now talking about the phases, the price can be considered in a descending correction. As the bearish impulse has already formed and been anticipating a correction, the price is making a descending correction pattern which shows that price might bounce to the upside sooner.

    Now talking about the candlestick language, if we observe that recently after 2 bearish candles, a bullish candle is formed. Similarly in here, 2 bearish candles have been formed, and now another bullish candle can be anticipated.

    VRA - 1D

    Moving down to the daily Time frame, the price is showing almost the same patterns, the price has the impulse to the downside, and now is in a descending correction which shows bullish signs.

    Now to make the situation more visible and clear, the price as discussed above is in a descending correction and is following a descending wedge pattern. Now most traders actually wait for the price to break to the upside and then enter, but as the majority expect that, it’s very possible for price to manipulate this pattern. As it can be seen on the chart, the level of $0.0174 has equal lows which show there is a lot of liquidity below that which price can target, and after grabbing that, a bullish run can be expected.

    Target Levels – Verasity (VRA)

    Talking about the targets the main target can be considered as the level of $0.0260 because that level contains an unmitigated order block. Which can serve as a magnet and can drive the price to that. Now first targets could be around $0.02258 as that’s an equilibrium of that wick and it serves as resistance. Why so? Because larger wicks on the higher time frame, mostly show any sort of order block or point of interest on lower time frame. Talking about the invalidation point, if the price breaks the level of $0.0154 this whole scenario would get violated. As that level contains an order block in the past which could serve as a support for the price, and if the price violates that, it will show that bears are in control.

  • Will Ethereum (ETH) move to touch $3,000

    Will Ethereum (ETH) move to touch $3,000

    Moving to the technical side of Ethereum, starting from the Weekly Time frame, the situation is very similar to BTC. The price recently tapped in a Weekly Order Block and got rejected from it.

    Now the way price tapped into that weekly Order Block was not that momentous and the way price rejected off that Order Block shows bullish strength. Now just below that weekly Order block at the level of $1689, there is much liquidity lying which could drive the price downwards. But could that happen now? Well right now, the majority of the traders are waiting for that level as S&R traders would be waiting for that level to get into longs, while institutions traders would be waiting for the price to grab that liquidity and then get into longs. But as the majority is expecting that, so it’s very possible that market makers might do an upfront run from this Order Block which would kick the FOMO situation is the traders and they would try to get in involved at higher rates and once these things happen, then it’s very possible that Ethereum would get dumped more below that liquidity till around $834 as there is some imbalance there.

    Eth - 1D

    Now the bullish move, for the time being, can end around $3770 as that’s an unmitigated Weekly Order Block, and just below that there is some imbalance left. There is one more Order Block which is around $2927 but as that is in a DISCOUNT PRICING, there is a very high chance that that gets induced just to trap early sellers.

    Moving down to the daily Time Frame, the price has lost its bearish Momentum, broke the Descending Correction, and is on its way to make a new Lower High which may eventually push the price to that Point of Interest.

    Moving more lower to the 4 Hour Time Frame, the price as soon as it touched the Weekly Order Block started to do a Wyckoff Accumulation and price is very likely to bounce now, as on 4 Hour Time Frame, at different Places there are imbalances left which can drive the price to them as a magnet.

    Now as this whole scenario is very much similar to the BTC movement, this is very much high probable, but sudden and unexpected moves in BTC can invalidate this whole scenario.

  • FLOW Coin – Time to drop Down?

    FLOW Coin – Time to drop Down?

    At the time of writing, Flow is being traded at $6.73 with a decrease of 1.73% In the last 24 hours. The total volume traded right now is around $208,708,798. The market cap of this coin is around $1,729,724,837 at the time of writing of this article

    Technical Analysis – Flow (FLOW):

    Starting from the Weekly Time Frame, if the price action of Flow is observed, after every few bearish impulsive, corrections are taking place with almost the same rhythm. The Order Flow is bearish and the structure shift hasn’t been observed yet. Now recently the price has again impulsively pushed down, and after that anticipating a correction.

    Moving down to the daily Time frame, the price of Flow has left an Imbalance when it was pushing downside. That inefficiency is not healthy for the market, so it’s very likely that the price of Flow would fill that before pushing down again. Moreover, the momentum now seems to be much weaker than it was first. Moreover, there is an unmitigated order block at $7.21 which can drive the price upwards as well.

    FLOW - 1D

    Now Jumping down to the 4H time frame, Price was pushing down. It was breaking structure, and along the way, it left some refined imbalance as well. Now we saw a structure shift here today moreover the low was stop hunted as well. So price does seem to show evidence towards the upside. Now we have two scenarios, one for long and one for short. Talking about the first scenario for long, there is an order block at $4.81 which is just a nice spot to buy. It lies within a discount pricing of Flow and moreover as the momentum is weak it’s very probable that the price might bounce from that level. Still, let’s talk about the second scenario which is of doing short.

    In case the price of Flow reaches the order block sitting at $6-20, then it’s a good price to short. That zone is a pattern of supply and demand as Drop Base Drop. Moreover, there is an imbalance just below. It so it’s very possible that in case another scenario gets violated this zone then might hold. Now if the short scenario plays out, the target could be the range we had looked for buy and vice versa. If the long scenario plays out, the target would be the sell zone from where we anticipated sales.

  • Dogecoin (DOGE) – Verge of Breaking out?

    Dogecoin (DOGE) – Verge of Breaking out?

    To have an idea about the technical part, as usual, it’s ideal to check out Higher Time Frame. Starting from the Weekly Time frame, the price of DOGE is quite bearish and is breaking structures to the downside. Price is very precisely following the Lower Low & Lower High pattern. Right now price on Weekly has broken structure and has made a Lower Low. Now potentially after every Lower Low, Lower High is formed. So, anticipating a Lower High gives us Bullish bias to some extent.

    Moving down to the Daily Time frame, the price action of DOGE is very supportive of the bullish bias. This is because of the bullish evidence it is giving at the moment. The previous Low which was sitting at $0.1313 on the 4th of December, the price on the 22nd of January took it low. This means that the liquidity which was sitting below that has been probably taken out which supports the bullish bias as the price has the necessary fuel is needed for any sort of impulse.

    Lower Time Frames – Dogecoin (DOGE)

    Now moving down to the 4 Hour Time Frame, there are a few confluences that are worth considering. First thing, the structure edge is to the upside, as the price is breaking structures to the topside. The Order Block which was formed after the first structure shift to the topside was mitigated while the second one to date remains unmitigated. Now price of DOGE is actually in a consolidation phase and liquidity is being engineered on both sides. It’s very possible that price might manipulate to the downside. Then the distribution move can take place to the upside which aligns with our HTF. Now talking about the invalidation point.

    DOGE - 1D

    Possible Reaction Zones

    If the price of DOGE in case breaks the level of $0.1256, then it’s very possible that all of these scenarios don’t even take place as the structural shift will be observed and only shorts would be preferred. Talking about the targets, the level of $0.11647 is a very great one as that’s an unmitigated Order Block from where the price may show the reaction to some extent.

    This weekly to 4-hour bias all aligns with the Btc movement as well. As on Btc the bearish momentum, for now, seems to have been lost. Meaning that buys of DOGE are kind of preferred which influences the buys in these alts as well. BTC movement is very important before considering only the technicals of each other coin.

  • Cardano  (ADA) Coin – To Show Bullish Move soon?

    Cardano  (ADA) Coin – To Show Bullish Move soon?

    ADA is one of the most bullish coins right now. The chart looks primed for a boost upwards. Starting from the weekly time frame, the price has been bearish as the change of structure has been already observed and a potential head and shoulder pattern is being formed. Right now the right shoulder is what we can anticipate and by that, the bias is almost bullish to some extent. This pullback can reach almost a price of $1.923.

    Now why this level? If the chart is observed on the weekly Time frame, there is an unmitigated order block which on Lower time frame also consists of a hidden Supply Zone that can drive the price of ADA to it and from there a potential reaction can be anticipated. Moving down to the daily Time Frame the price has many other confluences which can drive the price upwards.

    ADA - 1D

    Confluences  – Cardano (ADA)

    First, there was an impulsive move to the downside and as about the market cycles, after very impulsive moves, a correction is observed. Right now, the price of ADA is kind of lost its momentum and is doing Descending correction which is a sign of reversal. This potentially shows that the price can bounce upwards. Adding into that, as BTC has a very high influence on every other coin, and as BTC showing signs of bullishness as well, it’s very likely that this ADA alt can bounce upwards. Now as this situation is very clear, then it’s very likely that many people would be looking for buys, so it’s very likely that price might do some sort of manipulation. So right now the channel in which price is forming right now, the price might spike downside, and then after taking out most of the stop losses sitting behind this pattern.

    Possible Reaction Points

    After taking out that liquidity, the price of ADA may get the necessary fuel, which can potentially result in an impulsive move to the upside. Now the liquidity move can end around $0.908 from where if price shows some bullish evidence, which are structure shifts on lower Time Frame, then possible longs can be taken till the level mentioned above. Now once the price starts heading upside, there are several levels from where price might show some reversal so it’s important to have mid Take Profits. The good ones can be considered around $1.258 as there’s a Bearish Breaker Block while one more can be considered around $1.456 where a bearish Order Block is sitting from where the price might react.

  • Waves Coin Showing Strong Momentum during the Crash

    Waves Coin Showing Strong Momentum during the Crash

    Waves coin has been one of the most bullish coins and the top gainers of the market. Even with the BTC going down and the whole market red, it has shown strong momentum.

    Starting from the weekly Time frame, for the past 15 weeks, the candles which are being printed are bearish, and only 2 weeks within these bearish waves, the candles closed as bullish but still with very low volume. So it’s just not too great to go against such momentum. So the bias in which the weekly time frame is given is for short.

    Moving to the daily time frame, Structure wise the price of Waves is bearish but the momentum which price recently showed to the downside was huge which has left inefficiency within the candles which price is now filling or one can say has already filled 80%. There’s nothing more on weekly and daily and it’s still not enough confluences so now moving to the 4 hour time frame.

    Waves - 1D

    On 4H time frame, a change in the structure of Waves has been observed which could potentially give us a long opportunity but as the Higher time frame hasn’t given any major structure shift it’s preferable to go with the shorts. It can be observed that the area where price has recently reacted is a supply zone known as DROP BASE DROP but here, one can’t neglect the momentum. As when the price was pushing down, it didn’t just reverse immediately, it consolidated it manipulated, and then an expansion was observed to the upside.

    Fractal Movement

    As price is fractal, the same scenario is being witnessed but in the opposite direction. The price of Waves still has the momentum and it’s consolidating at the moment, and it’s very possible that price can reach the level of $12.87 as its 4H & Daily mitigation Block. Now in case one is to take long and the price doesn’t tap in our desired Point of Interest, the Breaker Block zone which is around $9.23 is a great place to take longs. As the momentum is strong, the likelihood of price to reach the Order block is very less.

    Short Position – Waves

    Now coming back to the shorting scenario, the invalidation point would be $13.71 as that is the structural high, while the targets could be the Breaker Block and $7.95 as just above that many Supply Demand traders would be interested to buy, whom price can take out.

  • Near Protocol (NEAR) – Will the Coin Price Touch ATH?

    Near Protocol (NEAR) – Will the Coin Price Touch ATH?

    Starting from the weekly timeframe, the candle of Near Protocol (NEAR) coin that got printed on the 17th of January to the 23rd of January had huge momentum and the volume of sellers in that was much strong. This candle engulfed the previous candle and by candle psychology, it shows the domination of bears right now.

    This candle of Near has made a decrease by around 42% which is huge. On weekly, before this bearish engulfing the level of $17.611 got induced as we see almost equal highs which were to trap early sellers, and those were taken out. This shows that the price has got the fuel which was necessary.

    NEAR - 1D

    Moving down to the Daily time frame, the price has shown some confluences which align with the weekly bias. Talking about the structure first, the price was breaking structure to the topside but the candle of 22nd of January broke the structure to the downside which showed the change of structure. Now the order flow is to the downside. Now recently the price of Near tapped in one of the daily Order Block which was around $9.472 but as the momentum is strong to the downside, the reaction was the price is giving at the moment can be merely considered as an inducement to take out early buyers.

    The Strong Bearish Momentum – Near Protocol (NEAR)?

    Along with this bearish momentum, the price left imbalance at some points, but talking about the main Point of Interest, the range between $13.579 to $15.134 is worth observing. Now we have two scenarios that can play out depending on where the price first taps. Although one can get short and long both opportunities as on higher time frame, the bias is still short so it’s preferable to short. So in case the price of Near taps in that daily imbalance zone, shorts can be taken. In case this zone doesn’t hold, there is one more zone from where shorts can be taken which is a Quasimodo Level which is at $17.487. Now, these are opportunities for taking shorts.

    Is Taking Longs a Good Idea?

    Now talking about longs, the Order Block which is at $7.694 Near, is a good zone. As the momentum has already been weakening because of the current consolidation, so AMD pattern can be expected to unfold. The manipulation phase and the momentum can let the price taps in that Order Block and once structure shifts are observed, longs then can be taken all the way till Quasimodo Level with TP 1 as that Imbalance Zone.