Tag: Technical Analysis

  • KAVA Coin – Showing Signs of Reversal?

    KAVA Coin – Showing Signs of Reversal?

    According to the market cap, the entire quantity of KAVA is approximately 154 million, with more than half of it, or 146 million, now in circulation. The coin is placed in 114th position according to its market capital on websites. It has a dominance of about 0.03 percent in the crypto market.

    KAVA is presently selling at $4.61 per coin.  In a single day, we have seen an increase of about 6% in the movement. The high and low for today are $4.69 and $4.04, respectively. Around 116% increase has been sen in the daily trading volume as well. KAVA reached an all-time high of about $9.21 in August 2021. During the crash in the market, the price dropped to almost t $2.10. The price did show a reversal but it was very weak in strength and we saw big red candles retracing back. In general, the price is making lower highs and lower lows. The price of KAVA increased by over 17.01 percent in January.

    Technical Analysis – KAVA

    The coin had been showing a downtrend for quite some time. The price had been creating lower highs and lower lows. It ultimately dropped down to the lowest possible point and left an order block in the creation. Now, this order block remained unmitigated for a number of weeks. After the price showed a shift in the structure, it was quick to come back up.

    kavausdt

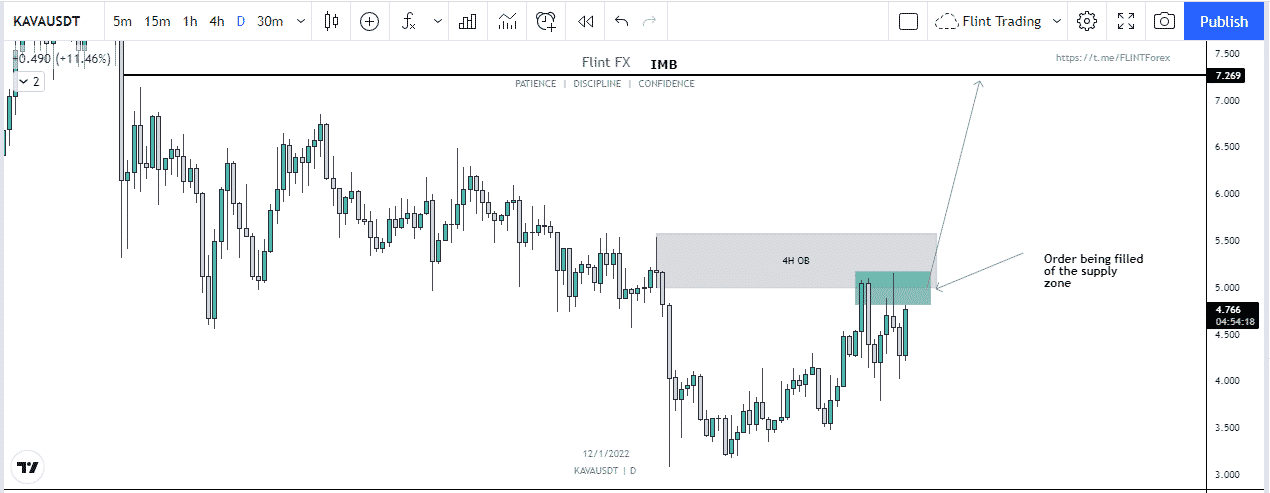
    Now on the daily time frame, the order block has been mitigated and there is no reason for the price to go down again. As a result, the price action of KAVA is very bullish and soon we can expect it to get out of the order block from where we can look for a possible long depending on the lower time frame confirmations that we find.

    Price Prediction

    KAVA is a wonderful investment that will bring excellent profits. KAVA is also seen as a solid investment by Wallet Investor. However, they predict that in a year’s time, the price will rise to $6.954. The price is predicted to reach $17.067 in five years. In the time frame of just one year, it can be seen that the price doesn’t increase that much. But In five years we can see visible gains in the price. For the long term, this project is a really good one. But traders on the other hand ae quite optimistic about the movement and they think that it wouldn’t be long before KAVA is being traded above its all-time high.

  • Chrono Tech (TIME) Creates new ATH

    Chrono Tech (TIME) Creates new ATH

    The price of TIME is about $484.61 at the time of writing, up 55 percent in a single day and while the rest of the market is floundering. It is currently one of the top gainers. Today, the volume has climbed by over 223 percent. The overall new volume is estimated to be roughly $16 million.

    During this time, the low point was around $311.79 and the high point was around $550.73. According to the most recent data released by the coin market cap, the currency has risen to number 150th, indicating that it is on many traders’ watchlists.

    TIME reached a near-all-time high in January, hovering around $575. The TIME coin has a very small supply of roughly 710k coins. Around all percent have been distributed in the market, according to coinmarketcap. As a result of this small supply, the coin has become gained a huge price with just a small market cap as compared to other coins.

    Technical Analysis –  Chrono.Tech (TIME)

    Talking about the technical Point of view of Time Token, there isn’t much to say from daily or even 4H time frame, as the price is just continuously going upside without doing any correction. This kind of move mostly results in a parabolic move to unfold, But moving down to the 30 m Time frame, It shows that quite a momentum was shown from the bear’s side which pushed the price down and which broke the structure to the downside.

    timeusdt

    Now going with the institutional order flow, it’s preferable to go with the sellers but not from here. there is a breaker block within the premium array from where a good reaction can be anticipated from where the lows can be targeted as that is a recent low and liquidity is present in there.

    Price Prediction – Chrono.Tech (TIME)

    TIME has been one of the market’s most optimistic coins. Despite the fact that the price of the coin has risen dramatically in just a few days. TIME is expected to reach a value of $470 in a year, according to wallet investor. When compared to the current price of the coin, this is an increase. In five years, the price is expected to reach more than $1183. However, traders are enthusiastic about the price movement and believe it will be worth much more in the future.

  • Utrust (UTK) – Where to headed now?

    Utrust (UTK) – Where to headed now?

    Utrust (UTK) was created to address the issues that have limited the use of cryptocurrency as a payment method, primarily the underdeveloped transactional security of payment systems and the relatively expensive fees.

    The platform’s major purpose is to create a system that allows merchants to access a broad audience of crypto holders by enabling fast and smooth crypto transactions at lower fees.

    Price Movement – UTRUST (UTK)

    UTK is now trading at $0.4313, up over 17.37% in the previous 24 hours, during the writing of this article.

    Within this time frame, the lowest value was near $0.3431 and the highest was around $0.4545. According to the coin market cap that provided the recent data, the coin is at 197th place and is on many traders’ watchlists. It is currently one of the top gainers among the top 200 coins.

    UTK approached its new All-Time High around the price of $1.06 during the month of May 2021. It was a quick upward surge, but the price has slowly retraced back to a lower level. Today’s trading volume, on the other hand, has risen by over 361 percent.

    The top exchanges for trading UTK are currently Binance, Huobi, Kucoin.

    Technical Analysis – UTRUST (UTK)

    Taking about the UTKtechnical, starting from the daily time frame, the price is more likely in a consolidation phase and is doing extreme huge rejections to either side, after an interval of time. Right now the majority of the wicks are to the upside, which on a lower time are respecting a descending trend line. Now as being liquidity above the trendline, it’s quite possible for price to stop hunting that and then continue down as it’s doing.

    utkusdt

    Moving down to the 4H Time Frame, the price recently reacted to an Order block and had rallied up. Now, this has made a double top inducing seller, so it’s likely for the price to stop hunting the stop losses present above them. An ideal entry would be a little below as marked, as the price is somewhat in a premium array and it’s not preferable to buy from the position where it is right now.

    Price Prediction – UTRUST  (UTK)

    Walletinvestor thinks that UTK is a good investment. According to them, the one-year projection puts the coin at two times the current price. In one year, the price is expected to reach a value of $0.6074. But the five-year projection puts UTK at a value of $1.607.

  • Keep3rV1 (KP3R) – On to New Heights?

    Keep3rV1 (KP3R) – On to New Heights?

    KP3R is ranked 180th in terms of market capital on coinmarketcap, with a market dominance of 0.01 percent. KP3R is currently being traded at $1,175 at the time of writing. In the last 24 hours, the price of the coin has risen by about 11%. The day’s high and low points are about $1,213 and $953.30. On the other hand, the daily trade volume jumped by about 187.17 percent in a single day.

    Even on the red day, the coin has shown strong momentum and has increased a lot becoming one of the top gainers today. The fall, KP3R had reached an all-time high of roughly $2065 in November 2021. During the drop, KP3R formed a bottom and fell to $547 in June. The coin displayed reversal, just like many other coins, and soon it was trading above the lowest low that it had formed. This month we have seen an increase of about 38%.

    KP3R has a total supply of roughly 201k tokens, with around all of them in circulation. KP3Rcan be purchased on a variety of exchanges, including OKEx, Binance, and CoinTiger.

    Technical Analysis – Keep3rV1 (KP3R)

    KP3R has a highly bullish chart in the creation. The price had been increasing continuously. On the 4H time frame we can see that the price had formed a double top and the pattern has now been completed. 4H time frame has been chosen to show a clearer chart as the daily wasn’t showing much.

    kp3r - 1D

    We can see that during the increase in the price, KP3R had created an order block that hadn’t been mitigated for a long time. The neck came down from where it bounced back but ultimately, the price came down and touched the order block. Now there is no visible reason for the price to drop down again. This means that overall, the price action is bullish and we can expect it to break the next resistance.

    Price Prediction – Keep3rV1 (KP3R)

    KP3Rhas been one of the market’s most optimistic cryptocurrencies. Even on red days, the price has increased a lot. KP3R is predicted to reach $2544 in one year, according to Walletinvestor. It is predicted to reach $8481 in five years. This suggests that KP3R has a lot of potentials and can generate a lot of money, Traders believe it won’t be long before it achieves new all-time highs and trades above its old-time high.

  • BOBA NETWORK (BOBA) – Where will it move Now?

    BOBA NETWORK (BOBA) – Where will it move Now?

    The total supply of BOBA is roughly 500 million, with less than half of it, or 158 million, now in circulation as according to the coin market cap. It is ranked 235th in terms of market capitalization, with a market share of near-zero

    BOBA is currently trading at $2.86  per coin, the price has nearly increased by 8% in a single day. Today’s high and low are $2.89 and $2.55, respectively. On the other hand, the daily trade volume has climbed by over 4%. BOBA hit its all-time high in November 2021, with a price of around $6.90. During the downturn, the price plummeted to roughly $2.54 in the month of December 2021. The price began to reverse, but, like many other coins, the reversal has been quite weak. The price is making lower highs and lower lows in general. In January, we observed an almost 1.98% decrease in the price of BOBA

    Technical Analysis – BOBA NETWORK (BOBA)

    Gaps can be the reason for the price to move in a certain direction. We can see that BOBA has a gap in the price that lies above the current value. This can drive the price upwards. This gap to date hasn’t been filled.

    When the price fell down from this level, it tried to rise up again but it was in vain as it fell down again. The price fell down and created a double bottom.

    BOBA - 1D

    Now both of these are confluences which can drive the price upwards. From here a possible long can be taken depending on the lower time frame confirmations. If we find the price to be bullish we can take an entry in the price with the final target as the gap that resides above.

    Price Prediction – BOBA NETWORK (BOBA)

    BOBA is a good investment and is going to provide great returns. Wallet investor considers BOBA to be a good investment as well. But according to them, in a year the price is expected to reach a value of $0.35. In five years the price is expected to reach a value of $2.880. In one year, the price is expected to decrease but the long-term hold is quite profitable according to them. Just like them, traders are also quite bullish on the price movement and think that it would hold much more value in the near future.

  • Decentraland (MANA) – On to hew Heights?

    Decentraland (MANA) – On to hew Heights?

    MANA is ranked 30th in terms of market capital on coinmarketcap, with a market dominance of 0.02 percent. MANA is currently being traded at $3.24 at the time of writing. In the last 24 hours, the price of the coin has risen by about 14%. The day’s high and low points are about $3.43 and $2.82. On the other hand, the daily trade volume jumped by about 218.17 percent in a single day.

    This new pump came after the news that Samsung joined Decentraland in their metaverse. Before the fall, MANA had reached an all-time high of roughly $1.67 in April 2021. During the drop, MANA formed a bottom and fell to $0.37 in June. The coin displayed reversal, just like many other coins, and soon it was trading above the old all-time high. This month we have seen a decrease of about 3%.

    MANA has a total supply of roughly 2.19B tokens, with around 1.82B in circulation. MANA can be purchased on a variety of exchanges, including KuCoin, Binance, and FTX.

    Technical Analysis – Decentraland (MANA)

    MANA since the news about Samsung had been pumping hard. Before this news, the price had been in consolidation and been ranging. The price before had failed to create a higher high and soon broke the structure.

    MANA -1D

    During this break of structure, the price failed to sustain the value. The price had left an order block in this zone that hasn’t been mitigated to date.  Now if we see the chart, we will notice that there is no visible reason for the price to go down now.  The price has had a bounce from the zone and the level has been respected many times showing that the support is strong. Now we can expect the price to move towards the higher high and higher low and mitigate the order block that lies above.

    Price Prediction – Decentraland (MANA)

    MANA has been one of the market’s most optimistic cryptocurrencies. As a part of Metaverse Projects, it is highly bullish. MANA is predicted to reach $5.680 in one year, according to Walletinvestor. It is predicted to reach $15.232 in five years. This suggests that MANA has a lot of potentials and can generate a lot of money, Traders believe it won’t be long before it achieves new all-time highs and trades above its old-time high.

  • Hex (HEX) – Where can the Price Go Now?

    Hex (HEX) – Where can the Price Go Now?

    As the blockchain analog of the Certificate of Deposit used in traditional financial markets, HEX is supposed to be a store of value to replace it. On the Ethereum network, HEX is based on the ERC network.  HEX is also built to take advantage of the Ethereum network’s burgeoning DeFi (Decentralized Finance) ecosystem in cryptocurrencies.

    The project allows the users to stake their coins and in return, new HEX coins are minted and provided to them. It includes measures that stimulate price appreciation and disincentives price damage. Stakers who cease their stake early are penalized by the HEX smart contract, while those who stake higher amounts of HEX for longer durations are rewarded.

    Price Movement 

    HEX is now trading at $0.2256, up over 6% in the previous 24 hours, during the writing of this article.

    Within this time frame, the lowest value was near $0.2117 and the highest was around $0.2292. According to the coin market cap that provided the recent data, the coin is at 201st place and is on many traders’ watchlists. It is currently one of the top gainers among the top 200 coins.

    HEX approached its new All-Time High around the price of $0.5323 during the month of September. It was a quick upward surge, but the price has slowly retraced back to a lower level. Today’s trading volume, on the other hand, has risen by over 21.64 percent.

    The top exchanges for trading the coin are currently HitBTC, Bitget, Uniswap.

    Technical Analysis – Hex 

    The coin is at a very decisive point from where its future movement can decide the trend of the market. If the price can stabilize itself here, we can look for a higher high and higher low. If it fails we can look for a mitigation of the order block that lies below.

    HEX - 1D

    The order block has remained untapped to date and the price movement of the next few days can decide whether it taps there or not. If it goes there, we can look for a possible long.

    Price Prediction – Hex  (HEX)

    Walletinvestor thinks that HEX is a good investment. According to them, the one-year projection puts the coin at two times the current price. In one year, the price is expected to reach a value of $0.530. But the five-year projection puts HEX at a value of $1.795.

  • BakerySwap (BAKE) – The new DEX

    BakerySwap (BAKE) – The new DEX

    People used to begin transactions themselves before the advent of digital order books. As there was the possibility of market manipulation, this resulted in human errors and manipulation. Then came the automated system, which reduced human-related concerns. When blockchain was first introduced, developers began integrating AMM technology into the blockchain network. Liquidity pools are accessible in AMM, and they include both assets on a trading pair. Other platform users supply liquidity, and in exchange, they receive rewards based on the quantity they provide and the network they use. BakerySwap (BAKE) is a DEX (decentralized exchange) that has implemented AMM.

    BakerySwap is a DEX that works with AMM. It is built on the Binance Smart Chain platform. Users can utilize BakerySwap to provide liquidity to various trading pairings in pools. Users that give more liquidity receive a higher reward based on the amount they have provided.

    What are Decentralized Autonomous Organizations (DAO)

    DAOs are open-source networks managed by computer programs created by some of their members without the intervention of central leadership. They are entirely run by their members, and there is no single leader. DAO is exemplified by BakerySwap (BAKE).

    The Native Token – BakerySwap (BAKE)

    Bake token is the native token of the BakerySwap ecosystem. The holders can vote on governance and get transaction fees, which is the major benefit of the token.

    Bake is currently priced at $1.20, representing a 3 percent increase over the previous month’s pricing and a 13 percent increase overall. The volume has increased by 48% in the last 24 hours. Bake’s ATH was created in the month of May 2021, with a price of $8.487. Bake’s lowest price ever was $0.998 in December 2021. BAKE is listed on a coin market cap on the 200th spot and has a market dominance of about 0.01%.

    Price Prediction – BakerySwap (BAKE)

    Bakery has a bright future ahead of it in the long run. Once the market rebounds from its present trend, traders expect the price to soar and break its All-Time High. According to Walletinvestor BakerySwap (BAKE) is a really good investment and soon people who take entries would be in profit. According to them, the price is expected to reach a value of $1.970 in one year. In five years the price of BAKE is expected to reach around $5.324.

  • CARTESI (CTSI) – Where will it move Now?

    CARTESI (CTSI) – Where will it move Now?

    The total supply of CTSI is roughly 1 billion, with less than half of it, or 489 million, now in circulation according to the coin market cap. It is ranked 166th in terms of market capitalization, with a market share of 0.02 percent.

    CTSI is currently trading at $0.7377  per share, up nearly 2.38 percent in the previous 24 hours. Today’s high and low are $0.753 and $0.7084, respectively. On the other hand, the daily trade volume has climbed by over 48.57%. CTSI hit its all-time high in May 2021, with a price of around $1.750. During the downturn, the price plummeted to roughly $0.3114 in the month of June 2021. The price began to reverse, but, like many other coins, it quickly reached near its all-time high. The price is making greater highs and lower lows in general. In January, we observed an almost 37% gain in the price of CTSI

    Technical Analysis – CARTESI 

    CTSI had been creating higher highs and higher lows at one point. The price was clearly in the uptrend and continued to print green candles. The price shot upwards and with a big wick, it failed to create another higher point and slowly started to decline. The price stayed in consolidation for a few days and created a supply zone but it eventually broke downwards.

    CTSI - 1D

    After the supply zone broke, the price went to decline again and we saw a steady decrease in the price. The candles became smaller and smaller to the point it became quite evident that the bears were losing steam. The price showed a reversal in the structure and we saw that the price went on o create a higher high and higher low. As a result, we can see that CTSI is bullish. The first target is the supply zone from where we can expect a reaction.

    Price Prediction – CARTESI (CTSI)

    CTSI is a good investment and is going to provide great returns. Wallet investor considers CTSI to be a good investment as well. According to them, in a year the price is expected to reach a value of $1.359. In five years the price is expected to reach a value of $3.993. Traders on the other hand are very bullish on the price and think that it wouldn’t be long before CTSI moves up to create a new ATH.

  • MyNeighbourAlice (ALICE) –  On the Verge of a Breakout?

    MyNeighbourAlice (ALICE) –  On the Verge of a Breakout?

    My Neighbor Alice, or MNA, is a new multiplayer building game with a fun player-driven storyline and easy blockchain-powered features that hope to appeal to the general gaming community.

    The game is set in Alice’s universe and offers a series of islands where players can purchase and expand plots of land by filling them with their inventions.

    Price Movement

    ALICE is currently trading at $14.09 at the time of writing. In the last 24 hours, the price of the coin has risen by about 6%. The day’s high and low points are about $14.30 and $13.29. On the other hand, the daily trade volume jumped by about 51.69 percent in a single day. ALICE is ranked 154th in terms of market capital on coinmarketcap, with a market dominance of 0.02 percent.

    Before the fall, ALICE had reached an all-time high of roughly $60 in March 2021. During the downturn, ALICE formed a bottom and fell to $3.17 in June. The coin displayed reversal, just like many other coins, but it wasn’t powerful enough. Since then, It has gone on to make new higher highs and lower lows.

    It has a total supply of roughly 100M tokens, with around 30M in circulation. ALICE can be purchased on a variety of exchanges, including KuCoin, Binance, and FTX.

    Technical Analysis – MyNeighbourAlice (ALICE)

    ALICE had a really clean chart. The price was continuously creating higher highs and higher lows. The price went on to create an impulsive high. After that, it failed to create a new high and the structure broke. After that, the price went down and all the gains got removed. It came down to the same level from where it got shot upwards.

    ALICE -1D

    After this drop, for the next few days, the price went into consolidation and is currently ranging. Now there is no reason for the price to go down again and we can look for a possible length for the price.

    Price Prediction – MyNeighbourAlice (ALICE)

    ALICE has been one of the market’s most optimistic cryptocurrencies. ALICE is predicted to reach $19.236 in one year, according to Walletinvestor. It is predicted to reach $46.287 in five years. This suggests that ALICE has a lot of potentials and can generate a lot of money, but experts believe it won’t be long before it achieves new all-time highs and trades above $60.