Tag: Technical Analysis

  • WinkLink (WINk) – Off to Bullish Movement?

    WinkLink (WINk) – Off to Bullish Movement?

    The TRON ecosystem’s first project to integrate the real world with the blockchain is WINk. Its goal is to assist in real-life situations. Wink is a renowned gaming platform dedicated to bringing high-quality decentralized applications to the masses. TRONBet was the platform’s name until mid-July when it was renamed Wink and their own native token, WINkLink, was created. TRONBet was the TRC network’s first decentralized application. Developers can use a variety of tools on the platform to create unique dApps in the game business.

    Price Movement – Winklink (WIN)

    The wink coin has a massive supply of roughly 999 billion tokens. Around 96 percent have been distributed in the market, according to coinmarketcap. As a result of this massive supply, wink has become extremely volatile, with many surprising reactions to various zones.

    At the time of writing, the price of WINkLink is about $0.000458, up only one percent in a day and down around 10 percent in the previous seven days. The volume today has increased by almost 14%. The new volume is around $314M.

    Overall in the month of December, we have seen a decrease of almost 33%. According to its market cap, the currency is ranked 152. WIN ATH is now around $0.002970.

    Technical Analysis – WinkLink (WINk)

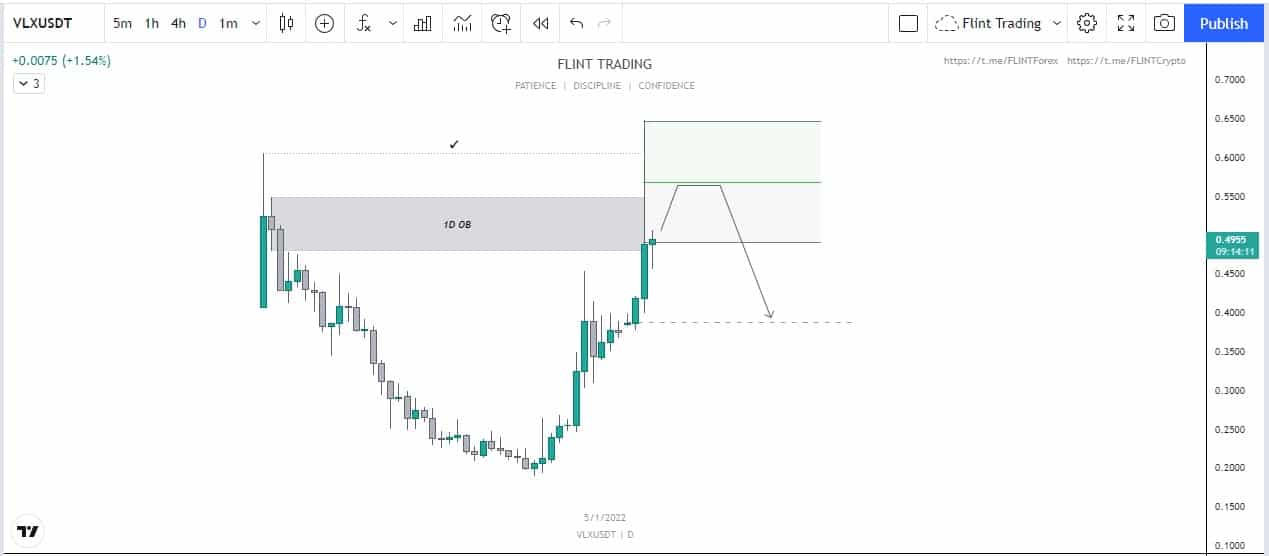
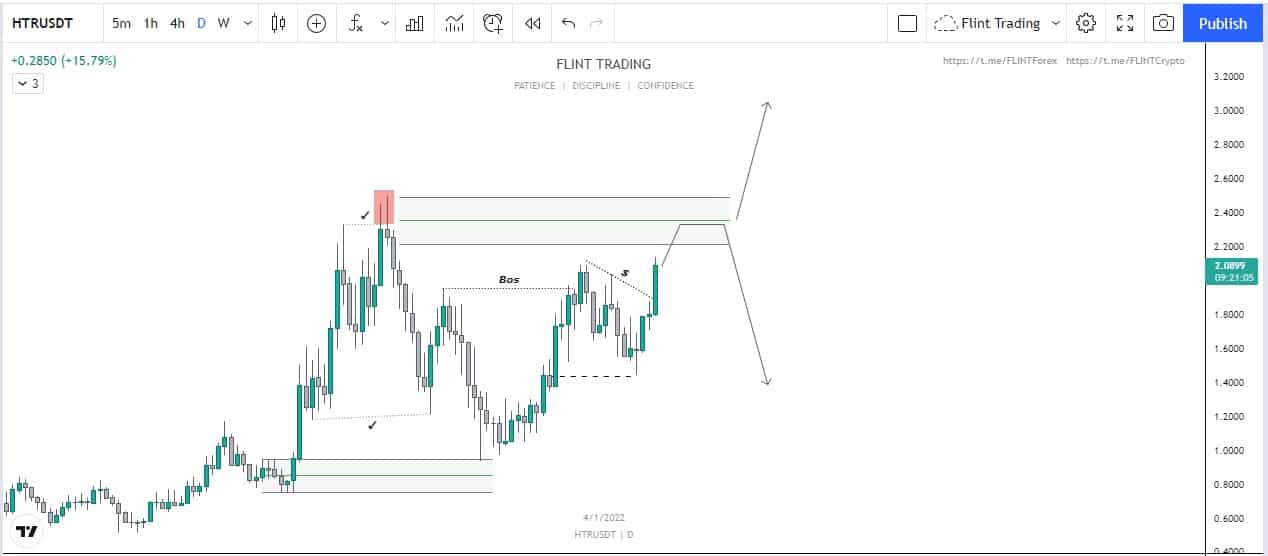
    Wink has been bearish for a lot of time. The price had been creating lower lows for quite some time and the price had been decreasing. During the drop in the price, WINK created an order block on the daily time frame. This order block hasn’t been mitigated to date. This can drive the price upwards.

    WINk - 1D

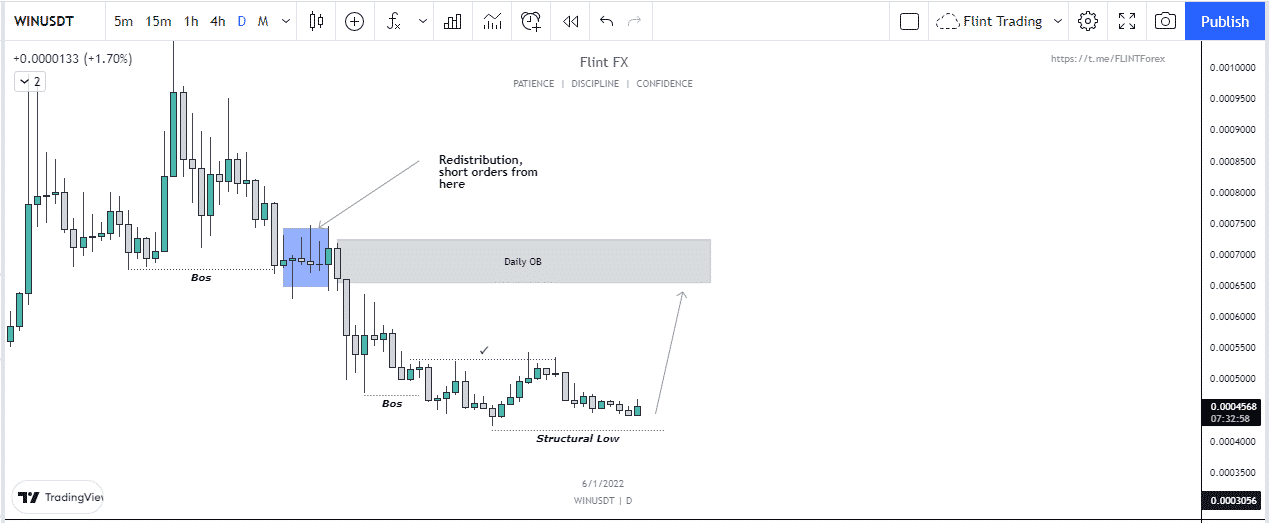
    Now the price has created a structural low. The price of WINK has slowed down which means that the bears are losing their steam. Now, as a result, we can expect a move from the coin very soon. The target for this move could be the order block that lies above from where the major red candles had been printed.

    Price Prediction – WinkLink (WINk)

    According to Walletinvestor WinkLink is not a good investment. According to their prediction, the price of Wink is to decrease to almost half of what it is right now. They think that in one year, the price is to reach a value of almost $0.000274 in one year. But traders are quite optimistic about the price movement and think that it would be valued much more in the future.

  • Skale Network (SKL) – Technical Analysis

    Skale Network (SKL) – Technical Analysis

    SKALE is a scaling network for Ethereum that is defined as a flexible network. The decentralized initiative focuses on decreasing latency and ensuring that transactions may be done as effectively as they can be, in addition to increasing transaction capacity. Those that develop on this platform, according to SKALE, may run Solidity smart contracts “thousands of times faster for a fraction of the mainnet cost,” with games and multimedia video sites among the applications that already use its technology.

    Price Movement – Skale Network (SKL)

    SKL is now trading at $0.2169, up over 5% in the previous 24 hours, at the time of writing this post.

    Within this time window, the low was around $0.1988 and the high was around $0.2185. According to the most recent data given by the coin market cap, the coin has risen to 121st place as a result of being on many traders’ watchlists. It is currently one of the top gainers.

    SKL approached its new All-Time High around the price of $1.07 during the month of March. It was a quick upward surge, but the price quickly retraced. Today’s trading volume, on the other hand, has risen by over 74.04 percent.

    The top exchanges for trading SKL are currently Binance, OKEx, Huobi Global.

    Technical Analysis

    SKL has a really clean chart. Before the drop in the price of the coin, SKL had been ranging and moving upwards. This kind of movement shows bearish sentiment and calls for a drop in the price which is exactly what happened. After the drop, the price of SKL dropped down and during this bearish move, the price created an order block on the daily time frame which hasn’t been mitigated to date.

    SKL - 1d

    Now at the lowest, we have seen a formation of a potential double bottom. This formation is a signal that the price is soon to move upwards. As a result, SKL is bullish. We can expect the price to tap in the daily order block that lies above. From there we can expect a reaction from the price of SKL.

    Price Prediction – Skale Network (SKL)

    Walletinvestor thinks that Skale is a good investment. But the one-year projection according to the website is very low. In one year, the price is expected to reach a value of $0.2100 which is less than the current value. But the five-year projection puts SKL at a value of $0.225.

  • TERRA (LUNA) – Where will it move Now?

    TERRA (LUNA) – Where will it move Now?

    According to coinmarketcap, the total supply of LUNA is around 832M LUNA and less than half of them around 360M of the LUNA are in circulation at the moment. It holds the 9th rank according to market cap and has a market dominance of 1.43%.

    At the time of writing LUNA is being traded at the price of $88.14 with a decrease of almost 5.38% in the last 24 hours. The maximum and minimum today are $93.67 and $86.66 respectively. The daily trading volume on the other hand has increased by almost 17%. LUNA had created its ATH in December 2021 and reached a price of almost $103.60. The price during the crash dropped down to a price of almost $3.91 in the month of July 2021. The price started to show reversal but like a lot of coins, and soon it created a new all-time high. Overall the price is making higher highs and higher lows. In January, we saw an increase of almost 3%.

    Technical Analysis – TERRA 

    LUNA had been one of the strong coins, the price of the coin was continuously increasing even when the price of BTC was dropping down. It had decoupled from BTC and continued to rise up. Now it looks like that the coin has run off steam.

    Luna has failed to create a new higher high and it looks like it will drop down. We can see that during these impulsive moves upwards, LUNA had left an imbalance in the price. As a result, we can expect a drop in the price of coins.

    LUNA - 1D

    If we draw a Fibo we can see that the range between $75 and $80 aligns with the golden zone of the Fibo level from the top. This is also the zone where the imbalance is present. This is an additional confluence to the price movement.

    Price Prediction – TERRA (LUNA)

    LUNA is a good investment and is going to provide great returns. Wallet investor considers LUNA to be a good investment as well. According to them, in a year the price is expected to reach a value of $208.275. In five years the price is expected to reach a value of $679.124. Traders on the other hand are very bullish on the price and think that it wouldn’t be long before LUNA moves up to create a new ATH.

  • Velas (VLX) –  What is the Chart Showing Us?

    Velas (VLX) –  What is the Chart Showing Us?

    At the time of writing, VLX is being traded at the price of $0.4621. The price of the coin has increased by almost 10% in the past 24 hours. The maximum and minimum of the day are around $0.4919 and $0.4202. The daily trading volume has on the other hand has also increased by almost 103.68% in one day. It is listed on coinmarketcap at 93rd spot according to market capital and has a market dominance of 0.05%.

    VLX before the crash had achieved its all-time high around the price of $5 in May 2021. During the crash, VLX created a bottom and dropped down to $0.035 in the month of June. Just like many other coins, the coin showed reversal but it wasn’t strong enough. It eventually went on to create new higher highs and lower lows since then.

    VLX has a total supply of around 2.24B tokens and all of them are in the circulation i.ie around 2.24B. It can be traded at a lot of different exchanges such as KuCoin, HitBTC, Gate.io.

    Technical Analysis – Velas (VLX)

    VLX has a really clean chart. We can see that the price of the coin had been dropping continuously a few days back. It was a constant decrease in the price but eventually, the bears lost momentum. That is when the price of VLX showed reversal. It remained there for two or three days and then shot upwards by printing big green candles.

    VLX - 1D

    Now during the drop, VLX had created a daily order block. It had also left an imbalance due to the presence of a wick. The middle point of the wick also coincides with the daily order block. We can expect the price of VLX to drop down after it mitigates that level. A drop till the imbalance zone and the breaker can be expected of the price from where we can look for a possible long.

    Price Prediction – Velas (VLX)

    VLX has been one of the highly bullish coins in the market. According to wallet investor, VLX in one year is expected to reach a value of $0.730. In five years, it is expected to touch $2.044. This shows that VLX has a huge amount of potential in it and would give an amazing return but traders think that it wouldn’t be long before it reaches a new all-time high and starts trading above $2.

  • Internet Computer (ICP) – What is the Chart showing us

    Internet Computer (ICP) – What is the Chart showing us

    The native token of Internet Computer is ICP. Just like many other coins ICP also depends on the movement of BTC.

    At the time of writing, ICP is being traded at the rate of $31.70 with an increase of almost 16% within the last 24 hours.

    The low within this tenure was around $27.23 and the high was approximately $31.70. The coin as being in the watchlist of many traders makes it rank all the way up to number 30th according to the latest data released by coin market cap. It is one of the top gainers today.

    ICP during the month of May approached its new All-time High around the price of $2,831. It was a fast wick upwards but soon, the price retraced back. The trading volume today on the other hand has also increased by almost 132%.

    The top exchanges for trading ICP are currently Binance, OKEx, Huobi Global.

    Technical Analysis –  Internet Computer (ICP)

    As shown in our analysis which you can find here, the ICP has shown the same movement as predicted. ICP is up to the level that had been shown. Now overall the price is bullish but we can expect a few setbacks during the tagging of the final target.

    ICP - 1D

    The first reason for the price to go up was the presence of imbalance above. Now the price has broken structure and we can see that it has created a higher high. The price of ICP has tagged the imbalance zone and we can expect a reaction from the price at this point. If the price stabilizes itself here we can look for another higher high. If it doesn’t we can expect a drop in the price of ICP. Right now we can expect the creation of a higher low. As the imbalance has also been mitigated and a new zone has also been created.

    Price Prediction – Internet Computer

    ICP has been one of the slow gainers in the market. According to wallet investor, the price of ICP is to reach a value of $1.736 in a year. For five year plan, wallet investors think that the price is to reach a value of $0.341. This means that the coin is considered a bad investment. Traders on the other hand are quite bullish on the movement and think that soon it would soon be trading above $100.

  • Aave (AAVE) – What can we Expect?

    Aave (AAVE) – What can we Expect?

    At the time of writing AAVE is being traded at the rate of $264.74 with a decrease of almost 5% within the last 24 hours.

    The low within this tenure was around $254.82 and the high was approximately $278.23. The coin as being in the watchlist of many traders makes it rank all the way up to number 49th according to the latest data released by coin market cap.

    AAVE made its all-time high in the month of May 2021 where it reached an enormous amount of $668. At the moment it has a daily volume of $505,691,969 with an increase of about 4% within the last 24 hours. The total supply of AAVE is now around 16M and the circulating supply is also 12M. AAVE has a dominance of 0.16%.

    The top exchanges for trading it are currently Binance, Huobi Global, KuCoin.

    Technical Analysis – Aave

    AAVE had been one of the bearish coins in the market. During the drop of BTC, it had been struck hard and had been damaged a lot. We can see that the drop in the price, had created a daily order block that has remained unmitigated to date. The price had dropped down really fast from where it had shown a reversal.

    AAVE - 1D

    The price had created a cup and eventually rose back up and completed the pattern. At this point, the price of the coin stabilized above the support and flipped the supply and demand zone.

    Now the price has been consolidating above the support. It looks like that that the cup and handle formation has been completed. At this point, the price of the coin is bullish and soon we can expect a move upwards which will tag the order block present above.

    Price Prediction

    AAVE has been one of the most successful and powerful coins. The people have gained a lot, based on this coin. In the long run, traders are highly bullish on the project. The price of AAVE has retraced back and is around the same price it had around the month of July 2021. According to the wallet investor, AAVE is a good investment. The price of the coin is to reach a value of $114.266 in a year. This means that wallet investors don’t think that AAVE is a good investment. But traders surely are bullish on the project.

  • COTI – What can we Expect?

    COTI – What can we Expect?

    At the time of writing, COTI is being traded at the rate of $0.3921 with an increase of almost 4% within the last 24 hours.

    The low within this tenure was around $0.3774 and the high was approximately $0.393. The coin as being in the watchlist of many traders makes it rank all the way up to number 170th according to the latest data released by coin market cap.

    COTI made its all-time high in the month of June 2019 where it reached an enormous amount of $1.13. At the moment it has a daily volume of $33,815,047 with an increase of about 18.70% within the last 24 hours. The total supply of COTI is now around 2B and the circulating supply is also 800.1M. COTI has a dominance of 0.02%.

    The top exchanges for trading it are currently Binance, Huobi Global, KuCoin.

    Technical Analysis – COTI

    COTI has one of the most beautiful charts that I have analyzed today. We can see that there are a lot of confluences that say that the price would go upwards. The first thing to notice is the daily order block that lies above the current price. This has remained unmitigated to date and can drive the price upwards to fill the gap.

    COTI -1D

    The second thing to notice on the chart is the trend line that the price of COTI had been following. The price had a rejection from this level before but ultimately the price had broken out of this trend line. After breaking out we find our third confluence which is the retest of the level. The price has retested the trend line and successfully held it. Not only that it had broken out of this range as well. All of these confluences show that the price of COTI is very bullish and we can soon expect the price to tap in the daily order block.

    Price Prediction

    COTI has been one of the most successful and powerful coins. The people have gained a lot, based on this coin. In the long run, traders are highly bullish on the project. The price of the coin has retraced back and is around the same price it had around the month of September 2021. According to the wallet investor, COTI is a good investment. The price of the coin is to reach a value of $0.720 in a year. In five years, the price is expected to reach around $2.043.

  • Hathor (HTR) –  Onto a New High?

    Hathor (HTR) –  Onto a New High?

    At the time of writing, HTR is being traded at the price of $2.0. The price of the coin has increased by almost 11% in the past 24 hours. The maximum and minimum of the day are around $2 and $1.69. The daily trading volume has on the other hand has also increased by almost 73% in one day. HTR is listed on coinmarketcap at 243rd spot according to market capital and has negligible market dominance.

    HTR before the crash had achieved its all-time high around the price of $1.88 in May 2021. During the crash, HTR created a bottom and dropped down to $0.23 in the month of May. Just like many other coins, the coin showed reversal and it was strong enough. HTR eventually went on to create a new all-time high around the price of $2.49 during the month of November.

    HTR has a total supply of around 900M tokens and has less than half of them in the circulation i.ie around 224M. It can be traded at a lot of different exchanges such as CoinMetro, Gtae.io, KuCoin, CoinEx.

    Technical Analysis – Hathor (HTR)

    We did an analysis of HTR a few weeks ago, which you can find here. You can see that the analysis has played out beautifully. Now what to expect further?

    We can see that the price of HTR is at a very crucial part. The price of the coin has shown a reversal in the structure and is now going to tap into a very important level. This would decide if the price would move further up or not.

    HTR - 1D

    We can see that a few weeks ago, the price had done a fake-out (red part in the chart) from where it had grabbed all the liquidity. Now the price is moving to that level again. If that level holds, we can expect a higher high otherwise it would result in a drop in the price.

    Price Prediction – Hathor

    It has been one of the highly bullish coins in the market. According to wallet investor, HTR in one year is expected to reach a value of $2.745. In five years, it is expected to touch $6.580. This shows that even though HTR has a huge amount of potential in it and would give an amazing return but traders think that it wouldn’t be long before it reaches a new all-time high and starts trading above $10.

  • Medibloc (MED) – Will it Reach $0.10?

    Medibloc (MED) – Will it Reach $0.10?

    The native token of Medibloc is MED. Just like many other coins MED also depends on the movement of BTC.

    At the time of writing MED is being traded at the rate of $0.05777 with an increase of almost 5.24% within the last 24 hours.

    The low within this tenure was around $0.0548 and the high was approximately $0.05924. The coin as being in the watchlist of many traders makes it rank all the way up to number 176th according to the latest data released by coin market cap. It is one of the top gainers today.

    MED during the month of July approached its new All-time High around the price of 0.0987. The trading volume today on the other hand has also increased by almost 164%.

    The top exchanges for trading MED are currently Upbit, Bittrex, Gate.io.

    Technical Analysis –  Medibloc (MED)

    On the monthly time frame, we can see that there hasn’t been any movement from the coin and the price is still in consolidation for the past few months. Moving to the lower time frame, we have seen a similar movement from the MED and the price has been ranging in two levels.

    MED - 1D

    As shown in the chart (BLUE AREA), the price is ranging between two extremes. SO we would look into this level alone to find a possible pattern. We can see that during the drop, the price of MED had created a daily order block. Moreover, we can see that there is no reason for the price to dropdown.

    We can expect the price to tap in the daily order block present above as it has remained unmitigated to date. At that point, we can expect a reaction from the price. If the price fails to hold (which is likely) we can see a drop in the price of MED.

    Price Prediction – Medibloc (MED)

    MED has been one of the fast gainers in the market. According to wallet investor, the price of MED is to reach a value of $0.117 in a year. For five year plan, wallet investors think that the price is to reach a value of $0.341. This means that MED is considered a good investment. Traders are quite bullish on the movement and think that soon it would break its old all-time high and create a new one.

  • AKASH NETWORK (AKT) – Where will it move Now?

    AKASH NETWORK (AKT) – Where will it move Now?

    According to coinmarketcap, the total supply of AKT is around 388M AKT and all of them around 29% of the AKT i.e. 113M are in circulation at the moment. It holds the 276th rank according to market cap and has a market dominance of 0.17%.

    At the time of writing AKT is being traded at the price of $2.29 with an increase of almost 8.77% in the last 24 hours. The maximum and minimum today are $2.29 and $2.09 respectively. The daily trading volume on the other hand has decreased by almost 22.68%. AKT had created its ATH in April 2021 and reached a price of almost $8.07. The price during the crash dropped down to a price of almost $2.28 in the month of July 2021. The price started to show reversal but like a lot of coins, it wasn’t strong enough. Overall the price is even lower than July 2021. In January, we saw an increase of almost 20%.

    Technical Analysis – AKASH NETWORK (AKT)

    AKT at one point was continuing the downtrend and was creating lower highs and lower lows. Soon the price started to move upwards. It wasn’t long before the price broke the structure and we were in the uptrend once again. During the drop of the price and the break of structure, AKT left an order block that got mitigated yesterday. Now the price is at a make or breakpoint.

    AKD - 1D77

    If the price stabilizes above this level, we can hope for a higher high which would take the price upwards to touch the equilibrium level. We can look for a retest to this order block and when it does we can take an entry into the market.

    If the price of AKT doesn’t stabilize itself above this point, it can cause the price to drop down further. Lower time frame confirmations should be taken into account.

    Price Prediction – AKASH NETWORK (AKT)

    AKT is a good investment and is going to provide great returns. Wallet investor considers AKT to be a good investment as well. According to them, in a year the price is expected to reach a value of $2.75. In five years the price is expected to reach a value of $5.36. Traders on the other hand are very bullish on the price and think that it wouldn’t be long before AKT moves up to create a new ATH.