Tag: Technical Analysis

  • LISK (LSK) – Where is it heading?

    LISK (LSK) – Where is it heading?

    At the time of writing, LSK is being traded at the rate of $2.37 with a decrease of almost 10.16% within the last 24 hours.

    The low within this tenure was around $2.36 and the high was approximately $2.67. The coin as being in the watchlist of many traders makes it rank all the way up to number 178th according to the latest data released by coin market cap.

    LSK made its all-time high in the month of May 2021 where it reached an enormous amount of $11.50. At the moment it has a daily volume of $6,958,645 with a decrease of about 78% within the last 24 hours. The circulating supply of LSK is now around 122M and the maximum supply is 144M. LSK has a dominance of 0.01%.

    The top exchanges for trading LSK are currently Binance, OKEx, KuCoin.

    Technical Analysis – LISK (LSK)

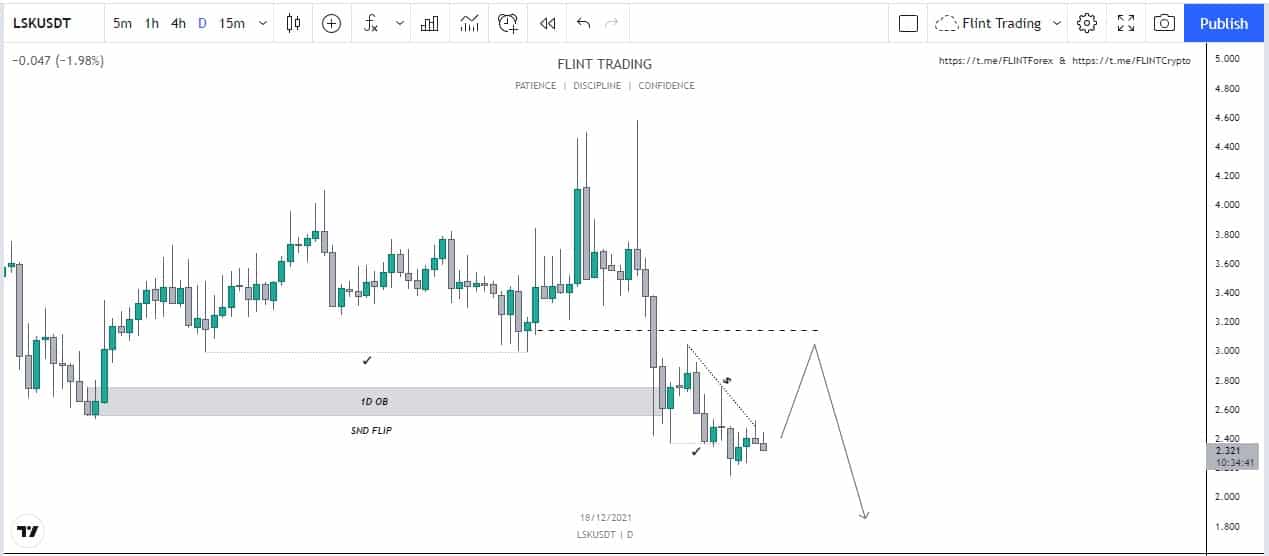
    LISK (LSK) had been printing higher highs in the price for a long time. The price was dropping down and eventually shifted the structure. During this movement, the price created an order block that remained unmitigated for a long time. The price eventually broke down and mitigated the order block. The price is now doing a downward correction while following a trend line.
    LSK - 1D

    Now we can look for a price to break out of this zone. From here we can look for a possible retest of the price. If the price retests the level and becomes stable, we can look for a possible higher high and a shift in the structure.

    If the price becomes stable, we can look for the price to touch the level of $3.2. From there a possible reaction can be expected of the price. From there a drop can occur in the price. That could be a nice point for a short.

    Price Prediction – LISK (LSK)

    LISK had achieved a huge value of $11 before the crash but unfortunately, it hasn’t been able to recover from the damage. In the long run, traders are highly bullish on the project. The price is currently at the same level where it was in May and has completely retraced back. According to the wallet investor, LSK is a good investment. The price of LSK is to reach a value of $4.511 in a year. In five years, the price expected to reach around $12.543

     

  • Velas (VLX) –  What is the Chart Showing Us?

    Velas (VLX) –  What is the Chart Showing Us?

    At the time of writing, VLX is being traded at the price of $0.2331. The price of the coin has decreased by almost 16.13% in the past 24 hours. The maximum and minimum of the day are around $0.2831 and $0.2265. The daily trading volume has on the other hand has also decreased by almost 75% in one day. VLX is listed on coinmarketcap at 130th spot according to market capital and has a market dominance of about 0.02%.

    VLX before the crash had achieved its all-time high around the price of $0.3499 in May 2021. During the crash, VLX created a bottom and dropped down to $0.036 in July. Just like many other coins, the coin showed reversal but and it wasn’t long before it went to create a new all-time high around the price of $0.54 during the month of November.

    VLX has a total supply of around 2.2B tokens and has nearly all of them in the circulation i.ie around 2.2B. VLX can be traded at a lot of different exchanges such as KuCoin, HitBTC, ZBG, FMFW.io.

    Technical Analysis – Velas (VLX)

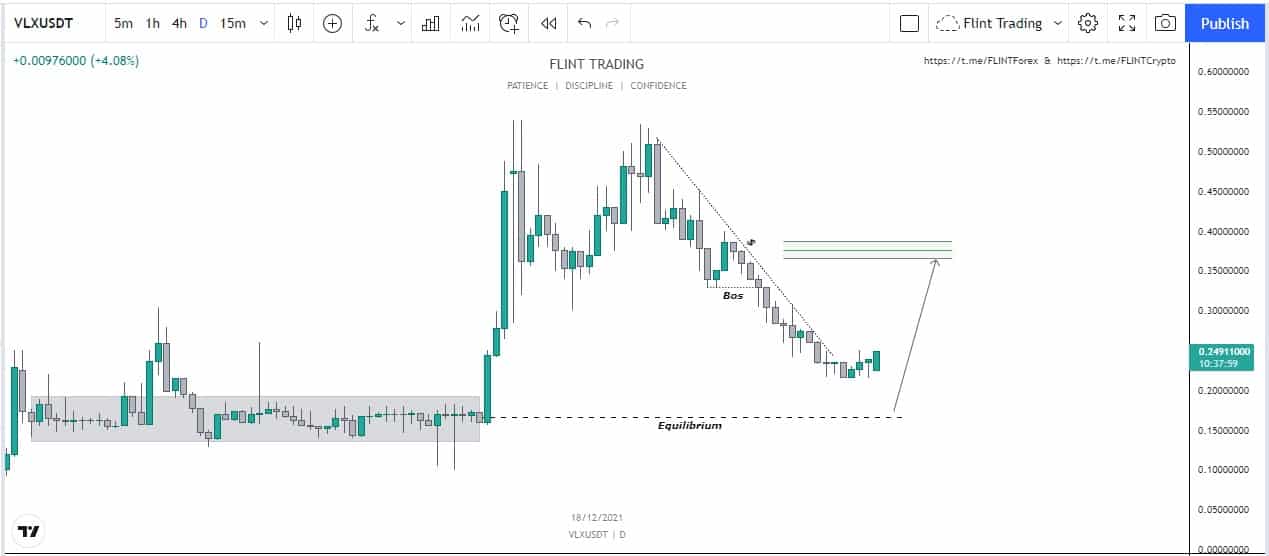
    Velas (VLX) has been consolidating for a long time and eventually broke out with gigantic green candles that resulted in the price achieving a new high. The price has continued to make a new higher high but it wasn’t able to sustain the price and broke down. The price broke the structure and is now going down.

    VLX -1D

    A point of interest is the equilibrium point of the consolidation which can be the reason for the price to a dropdown. Right now, the price is dropping down and is respecting the trend line.

    We can expect the price to drop down from where we can look for a possible long entry in VLX . Lower time frame confirmations should be taken into consideration to have a clean entry in the price. The final target for the price lies around $0.40.

    Price Prediction – Velas (VLX)

    Velas (VLX) has been one of the highly bullish coins in the market. According to wallet investor, VLX in one year is expected to reach a value of $0.582. In five years, it is expected to touch $1.649. This shows that VLX has a huge amount of potential in it and would give an amazing return to the people who would hold it.


  • Internet Computer (ICP) – Where can the Price Go?

    Internet Computer (ICP) – Where can the Price Go?

    The native token of Internet Computer Network is ICP. The coin has had its downfall in the past but it looks like it is ready to go for a higher leg now.

    During the writing of this article, ICP is being traded at the rate of $24.25 with a decrease of almost 8% within the last 24 hours.

    Today the price had a low value of $23.88 and a high was approximately $26.30. The coin as being in the watchlist of many traders makes it rank all the way up to number 36th according to the latest data released by coin market cap.

    ICP made its all-time high in the month of May 2021 where it reached an enormous amount of $2,831. At the moment it has a daily volume of $212,989,689 with an increase of almost 100% within the last 24 hours. The circulating supply of ICP is now around 475M. ICP has a dominance of 0.21%.

    The top exchanges for trading the coinare currently Binance, Coinbase.

    Technical Analysis –  Internet Computer (ICP)

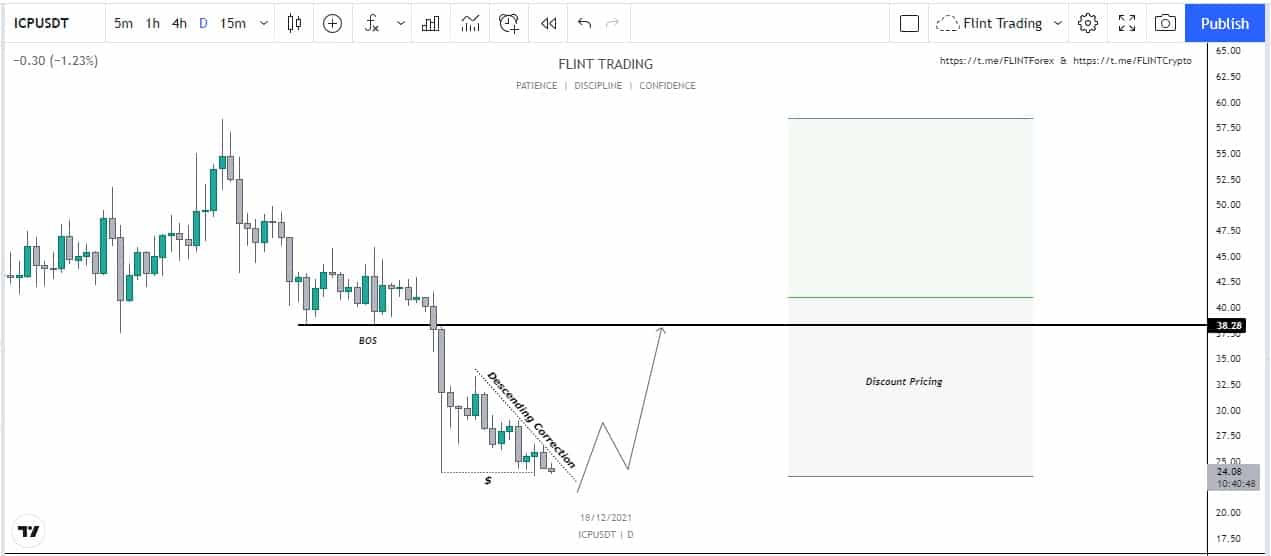
    ICP had been one of the slow gainers and hasn’t been able to recover the price. The price has broken structure and is dropping down. It was triggered by a red wick down. After this, the price went down to a downside correction.

    The price at this point doesn’t have any reason to drop down even more down. Now we can expect the price to go up and do a retest from where we can look for a possible long. The price of ICP can go up and touch the break of structure point. The price at that point is $38.

    ICP -1D

    We are currently in the discount pricing from where can look for a possible entry. Lower time frame confirmations should be taken into consideration before taking an entry to have a clean point.

    Price Prediction – Internet Computer (ICP)

    According to digital coin price, the price of ICP is to reach a value of $41.99 in a year. For a five-year plan, the price will reach a value of $105. But the investors are even more bullish on the value and they think that it will reach even more. Internet Computer has been growing its network and is bringing new partnerships to the network. It can be said that ICP would definitely provide good returns in the future.


  • Polkadot (DOT) – Where will it move Now

    Polkadot (DOT) – Where will it move Now

    According to coinmarketcap, the total supply of DOT is around 1.1B DOT and around 987M of the DOT are in circulation at the moment. It holds the 10th rank according to market cap and has a market dominance of about 0.10%.

    At the time of writing DOT is being traded at the price of $25.05 with a decrease of almost 9% in the last 24 hours. The maximum and minimum today are $27.70 and $24.78 respectively. The daily trading volume has also decreased by almost 16.73%. DOT had created its ATH in November 2021 and reached a price of almost $55.05. The price during the crash dropped down to a price of almost $10.37 in the month of July 2021. Overall the price is moving for higher highs. In November, we saw a decrease of almost 11%. This month, we have seen a decrease of almost 34%.

    Technical Analysis – Polkadot (DOT)

    DOT at one point had been highly talked about. During the news of Parachain auctions DOT had been printing higher highs and eventually achieved all time high.

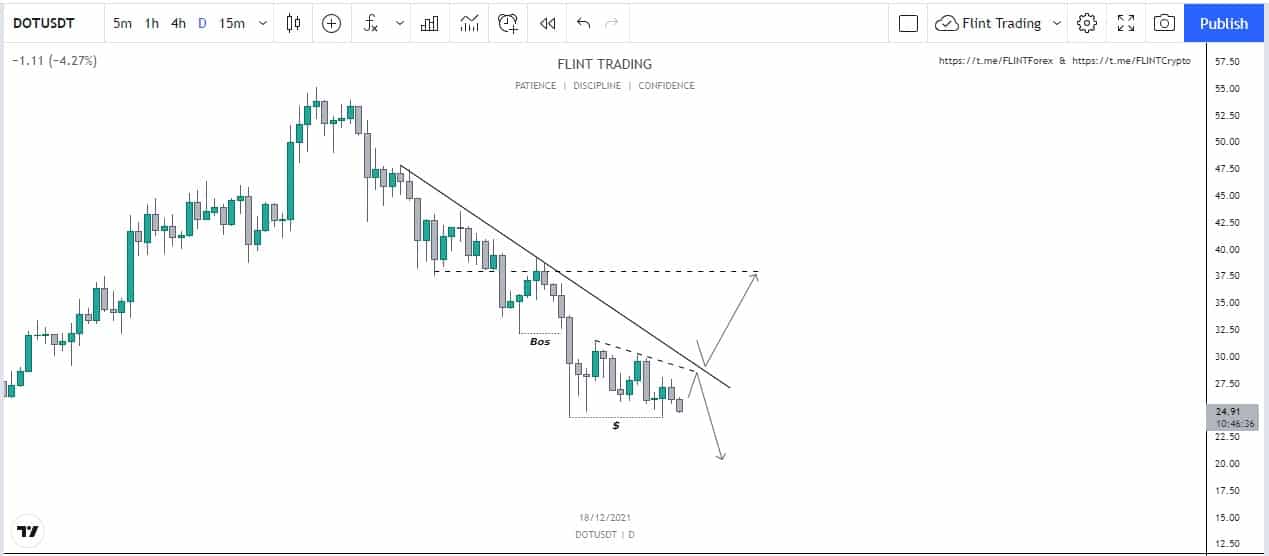
    It can be seen on the chart that DOT had shown a reversal in the structure and soon started to fall down making lower lows and lower highs. The price had been following and respecting the trend line from where it had rejected from many times. Now the price is at the make or break point.

    DOT -1D

    The price can try to touch the trend line again from where we can expect a reaction from the price. If the price gets rejected from there we can look for a lower low and eventually at a low price level. If the price becomes stable above the trend line and gives a valid retest we can look for a reversal in the price  and eventually a shift in the structure which would lead to the first target of $38.

    Price Prediction – Polkadot (DOT)

    DOT is a good investment and is going to provide great returns. Wallet investor considers DOT to be a really good investment as well. According to them, in a year the price is expected to reach a value of $55.340. In five years the price is expected to reach a value of $161.378. Traders on the other hand are very bullish on the price and think that it wouldn’t be long before DOT moves up to create a new ATH.


  • XRP (XRP) – What is the Chart Showing Us?

    XRP (XRP) – What is the Chart Showing Us?

    At the time of writing, XRP is being traded at the rate of $0.8301 with an increase of almost 2.54% within the last 24 hours.

    The low within this tenure was around $0.7798 and the high was approximately $0.8401. The coin as being in the watchlist of many traders makes it rank all the way up to number 8th according to the latest data released by coin market cap.

    XRP made its all-time high in the month of April 2021 where it reached an enormous amount of $1.9669. At the moment it has a daily volume of $3,013,238,251 with an increase of only 6.52% within the last 24 hours. The circulating supply of XRP is now around 47.25B and the maximum supply is 100B. XRP has a dominance of 1.74%.

    The top exchanges for trading XRP are currently FTX, Binance, ByBit, KuCoin.

    Technical Analysis – Ripple

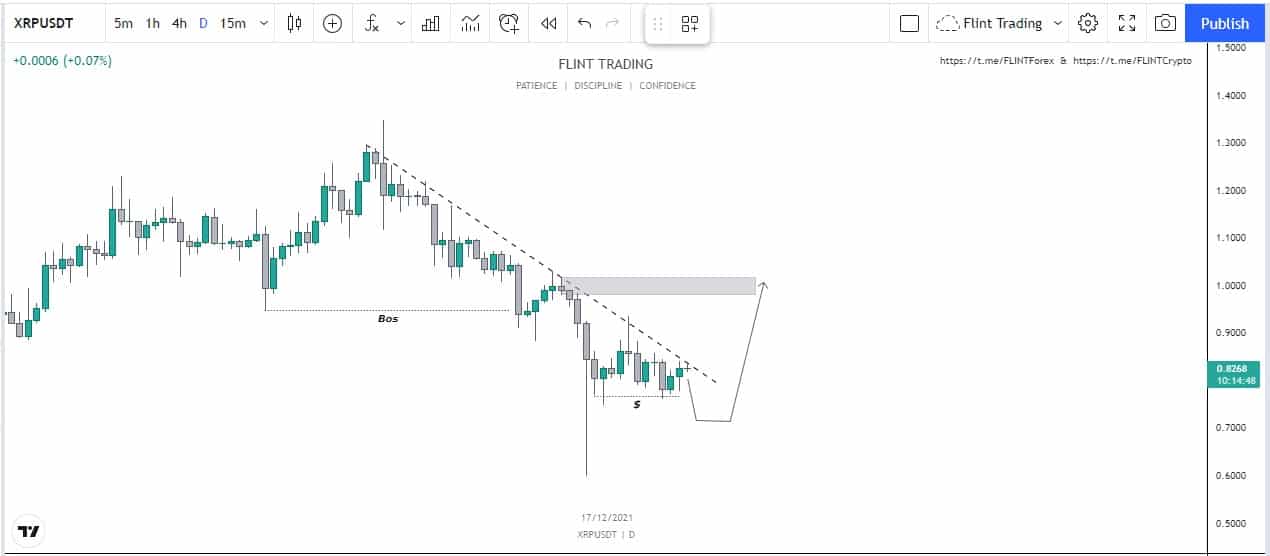
    Ripple (XRP) has been on the downtrend for a lot of time During the past two weeks the price had been dropping down continuing to make lower lows and highs. The price of the coin had been following a trend line and had broken the structure in its wake.

    Now the price had broken structure and is on the fall. During this BOS, the price went down and left an order block. This order block has remained unmitigated to date. The price dropped down and grabbed liquidity and went back to close up again.

    XRP -1D

    Now we can expect the price to drop down and mitigate the middle of the wick that happened before. From there we can look for additional confluences to look for the possible movements of the coin. Now apparently there isn’t any reason for the price to a dropdown. So we can expect the price of XRP to go up and mitigate the order block that is present above.

    Price Prediction – Ripple (XRP)

    Even though XRP has been one of the fast gainers and has been able to break out successfully. In the long run, traders are highly bullish on the project. The price is currently at the same level where it was in August and has completely retraced back. According to the wallet investor, XRP is a good investment. The price of XRP is to reach a value of $1.454 in a year. In five years, the price expected to reach around $3.917.

  • What is Kadena (KDA) and How does it Work

    What is Kadena (KDA) and How does it Work

    Kadena (KDA) is a blockchain that is both public and private. That is, it combines elements of both public and private blockchains: public blockchain, which encourages growth by not limiting the number of users and is open to all, and private blockchain, where parties are restricted from accessing the blockchain and users must first gain access to the network before using it. Even if the blockchain is open to everyone, it still contains qualities like integrity, transparency, and security in hybrid blockchain. The blockchain that is to be hybrid is Kadena (KDA)

    Despite the fact that cryptocurrency is a revolutionary cry against autocratic Big Finance, it still has an energy problem. Bitcoin mining consumes a lot of fossil fuels. And, since this became clear, a slew of new cryptocurrencies have attempted to make cryptocurrency mining more practical and environmentally benign. This, as well as the question of scalability, is at the heart of the Proof-of-Stake vs. Proof-of-Work dispute. The Proof-of-Work POW technique was chosen by Kadena (KDA). The POW technique actually has a scalability difficulty, however, Kadena appears to have overcome the problem. Testing will be done later this year to see if Kadena’s claim of 100,000 TPS is true or not.

    Price Movement – Kadena

    At the time of writing this article, the value of Kadena is $13.73, a 40% over the past twenty-four hours. Kadena (KDA) also added NFTs to its network by coming into partnership with Immutable Records, following which the value of the coin jumped from $2.72 to its current value. Kadena promises its users safer smart contracts that have protection unlike that of Ethereum, No-cost transactions by the introduction of a gas station which eliminates transaction fees, Energy-efficient at scale which has already been described in detail above, Proven security because of POW, and Industrial Scalability that has been devised the Kadena team to power the evolution of the global financial system.

    Price Prediction – Kadena (KDA)

    In the long run, it is a highly good opportunity. In September it was being traded at the price of around $0.74 and now it has crossed fifteen dollars. According to the wallet investor, the price of KDA is to reach a value of $29.916 in a year. For a five-year plan, the price will reach a value of $107.616. The way the price of KDA has grown, the traders are even more bullish on the value and they think that it will reach even more.


  • Litecoin (LTC) –  What is the Chart Showing Us?

    Litecoin (LTC) –  What is the Chart Showing Us?

    At the time of writing LTC is being traded at the price of $156.02. The price of the coin has increased by almost 3.87% in the past 24 hours (Practically at the same position). The maximum and minimum of the day are around $156.62 and $142.10. The daily trading volume has on the other hand has also increased by almost 25% in one day. LTC is listed on coinmarketcap at 18th spot according to market capital and has a market dominance of about 0.47%.

    LTC before the crash had achieved its all-time high around the price of $433.5 in May 2021. During the crash, LTC created a bottom and dropped down to $113.8 in July. Just like many other coins, the coin showed reversal but it wasn’t strong enough and now is nearly at the bottom again and has nearly retraced back to the position which it had during the month of August.

    LTC has a total supply of around 84M tokens and has nearly all of them in circulation i.ie around 69.17M. LTC can be traded at a lot of different exchanges such as Binance, OKEx, Mandala Exchange, and Huobi Global.

    Technical Analysis – Litecoin (LTC)

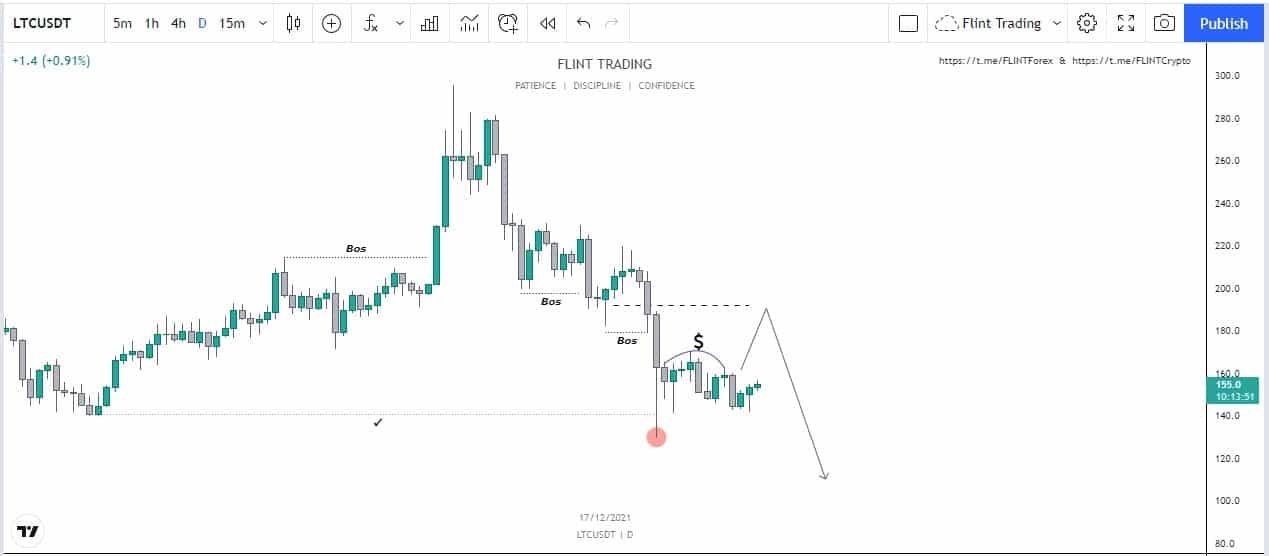
    Litecoin by many people has been used as a top signal. The price went on to create a high but couldn’t sustain it and eventually dropped down which resulted in the shift of structure.

    The price has now broken the structure and now is on a downtrend. Price of LTC has grabbed the liquidity at the bottom and eventually moved up again.

    LTC -1D

    Now during this break of structure, it can be seen that the price had left an imbalance in the candles and has shown inefficiency. We can expect the price of LTC to move upwards and fill this gap from where a reaction can be expected. If the price fails to hold this level, it can drop down to an even lower liquidity grab otherwise we can look for a higher high.

    Price Prediction – Litecoin (LTC)

    Litecoin (LTC) has been one of the highly bullish coins in the market. According to wallet investor, LTC in one year is expected to reach a value of $245.265. In five years, it is expected to touch $592.380. This shows that LTC has a huge amount of potential in it. It would give an amazing return to the people who would hold it.


  • Stacks (STX) – Where will it move Now?

    Stacks (STX) – Where will it move Now?

    According to coinmarketcap, the total supply of STX is around 1.8B STX, and around 1.0B of the STX are in circulation at the moment. It holds the 63rd rank according to market cap and has a market dominance of about 0.10%.

    At the time of writing STX is being traded at the price of $2.33 with an increase of almost 18% in the last 24 hours. The maximum and minimum today are $2.38 and $1.87 respectively. The daily trading volume has also increased by almost 194.00%. STX had created its ATH in December 2021 and reached a price of almost $3.256. The price during the crash dropped down to a price of almost $0.50 in the month of July 2021. Overall the price is moving to higher highs. In November, we saw an increase of almost 50%. This month, we have seen a decrease of almost 18%.

    Technical Analysis 

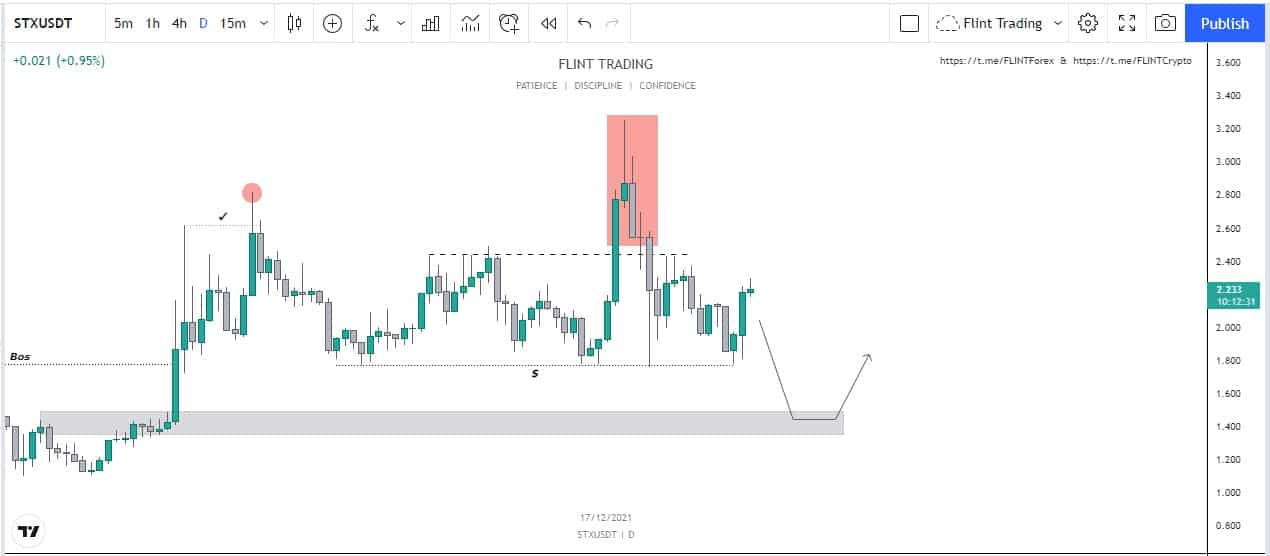
    On the daily time frame, we can see that the price has been ranging in a zone. At one point, the price did a massive move upwards and grabbed all the liquidity above. After this move, the price fell down again to come back and close in the same level.

    It can be seen that the price had followed the channel in a very good way. STX had bounced and got rejected from the level many times.

    STX - 1D

    Now the point of interest is the daily order block. This order block was formed when the price broke upwards and shifted the structure of the market. Now until now, this order block has remained unmitigated. We can expect the price to drop down and touch the level from where we can look into a possible long position.

    Lower time frame confirmations should be taken into consideration as the price can bounce from the zone itself instead of coming down to the level of order block. Failure of this scenario would be price moving upwards and stabilizing above $2.45 in which case this case would be invalidated.

    Price Prediction – Stacks (STX)

    According to the traders, STX is a good investment and is providing a great return. Wallet investor considers STX to be a really good investment as well. According to them, in a year the price is expected to reach a value of $3.249. In five years the price is expected to reach a value of $8.890.

  • Harmony (ONE) – Where will it move Now?

    Harmony (ONE) – Where will it move Now?

    According to coinmarketcap, the total supply of ONE is around 13.2B ONE and around 11.46BM of the ONE are in circulation at the moment. It holds the 65th rank according to market cap and has a market dominance of about 0.09%.

    At the time of writing ONE is being traded at the price of $0.1784 with an increase of almost 1.88% in the last 24 hours. The maximum and minimum today are $0.1936 and $0.173 respectively. The daily trading volume has also increased by almost 100.31%. ONE had created its ATH in October 2021 and reached a price of almost $0.38. The price later dropped down to a price of almost $0.35 on the 4th of December in 2020. Overall the last two months have been bearish for the price. In November, we saw a decrease of almost 17.17%. This month, we have seen a decrease of almost 30%.

    Technical Analysis – Harmony (ONE)

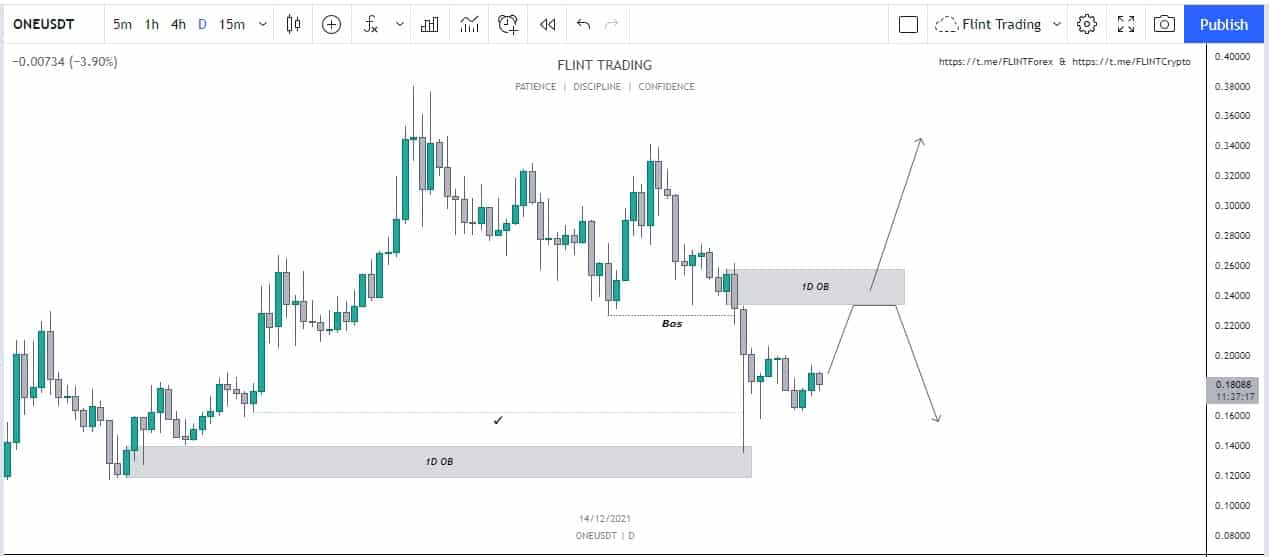
    Harmony (ONE) when shifted the structure towards the upside left an order block in creation. This order block was created after the last lower high was invalidated and the price broke upwards. The price went and created the top from where it failed to create another high which showed the reversal in structure.

    The price fell down and mitigated the untouched order block. During this ONE created a new order block that is above the current price level.  Now there can be two possible movements for the price.

    ONE - 1D

    One is that the price can move upwards and touch the order block. From this level, a reaction can be expected that can drive the price to either side (bullish or back to the same range). We need to look for the lower time frame confirmations in order to know the possible movement of the price.

    If ONE becomes stable above, we can expect a long on the retest of the order block. If the price fails to hold, it would result in the drop of the price again to the 1D order block at the bottom.

    Price Prediction – Harmony (ONE)

    According to the traders, ONE is a good investment and is providing a great return. Wallet investor considers ONE to be a really good investment as well. According to them, in a year the price is expected to reach a value of $0.4067. In five years the price is expected to reach a value of $1.311.


  • KuCoin Token (KCS) – Where will it go Now?

    KuCoin Token (KCS) – Where will it go Now?

    KuCoin Token (KCS) is the native token of KuCoin exchange that is used for a variety of purposes.

    At the time of writing this article, KCS has a value of $20.71 (0.11% increase today) with a trading volume of $13,471,492, with an increase of about 7% over the past 24 hours.

    KCS is listed on coinmarketcap in the 71st place. It has a market dominance of about 0.07%. KCS had created its all-time high around the price of $28.776 in December 2021 and later fell down to the price of $17.816 in the same month.  This month has been bearish for the price and we have seen a decrease of about 22.5% in December. November was however very bullish for the price and we saw an increase of about 47.12% in the price.

    The maximum supply of KCS is around 170M while the current circulating supply is around 80.1M coins.

    Technical Analysis – KuCoin Token (KCS)

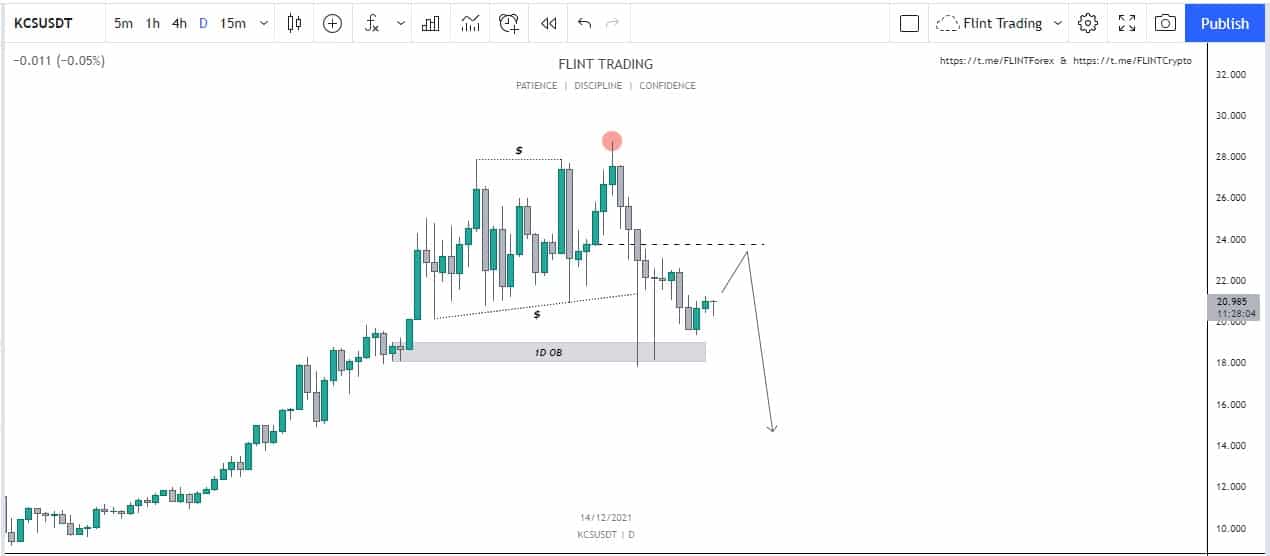
    On the daily time frame, we can see that the price in the past had created an order block in the past. This was created when the price broke the last structure. This order block has been unmitigated for a long time.

    The price of KCS was consolidated for a long time and eventually did a fake-out which resulted in the drop in price. The price had dropped down to mitigate the order block. It can be seen that the price dropped for five-six consecutive days.

    KCS - 1D

    The price fell down to mitigate the order block. Now there is two points of interest that should be taken into notice. One is the equilibrium point of the consolidation zone. The second is the lower values of the price. This middle point can drive the price upwards from where we can expect a possible reaction. If the price becomes stable above, we can look for a higher high in the price. If the price fails to hold this level, chances are that we will go down to an even lower value in the price.

    Price Prediction – KuCoin Token(KCS)

    According to wallet investor, KCS is one of the most successful investments in the market. According to their predictions, KCS is expected to reach a value of $39.80 in a time span of one year. For a five year plan, the price is expected to reach a value of $114.672