Tag: walletinvestor

  • MINA – Where will it move Now?

    According to coinmarketcap, the total supply of MINA is around 824M coins and around 315M coins are in circulation at the moment. It holds the 86th rank according to market cap and has a market dominance of about 0.05%.

    At the time of writing the coin is being traded at the price of $3.71 with a decrease of almost 9.70% in the last 24 hours. The maximum and minimum today are $4.15 and $3.70 respectively. The daily trading volume has also decreased by almost 33.72%. MINA had created its ATH in November 2021 and reached a price of almost $6.674. The price later dropped down to a price of almost $4.547 and the monthly candle closed there. Since then the price has shown reversal and has been on the same trajectory since then. This month alone, we have seen a decrease of about 17.64% in the price.

    Technical Analysis

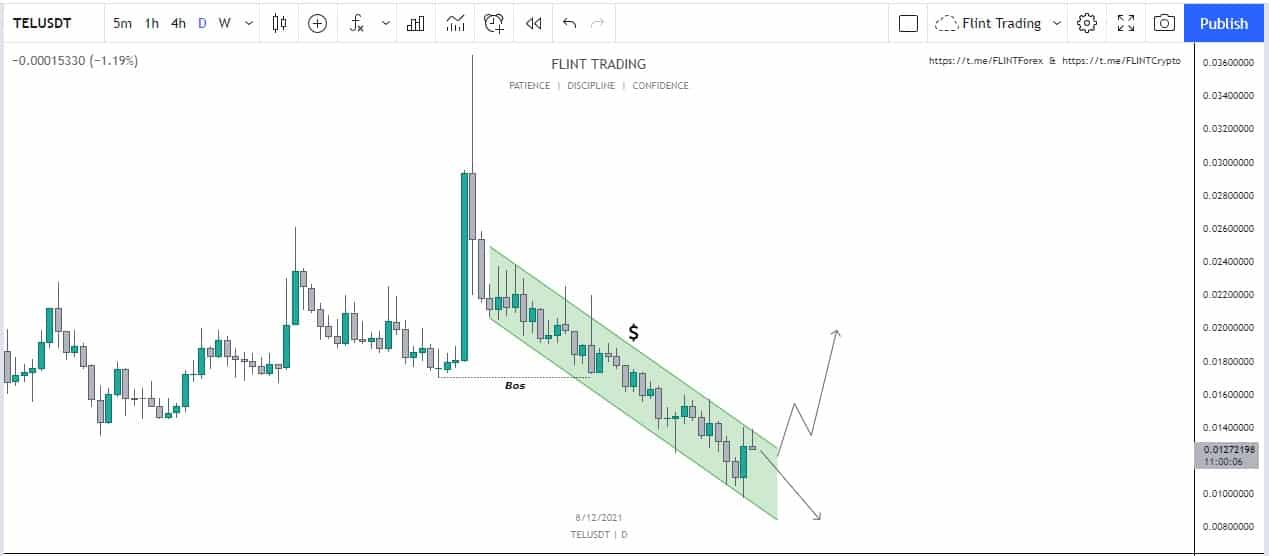
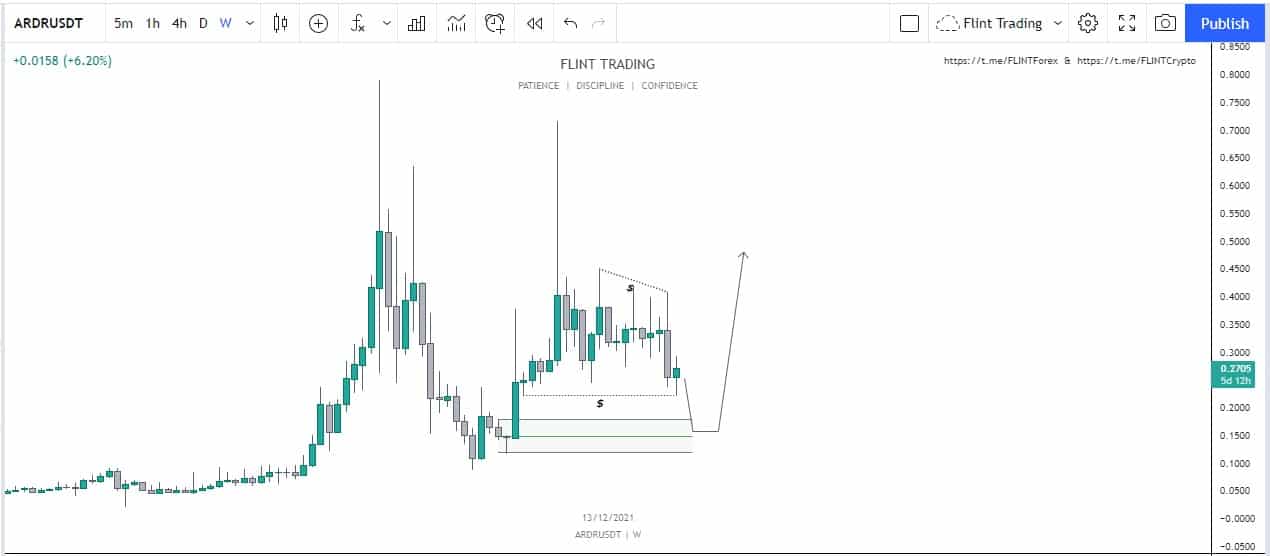
    On the daily time frame, we can see that the price had a drop from where it started to range for some weeks. It can be seen that soon after, the price went up to mitigate the order block. In this move, it grabbed the liquidity above as well by creating a new all-time high. After touching it, the price dropped down hard and made lower lows.

    Now a point of interest is the daily order block that is lying below, MINA has mitigated this level a few days back and has bounced from there. We can expect the price to reach the middle of the triggering order block, from where we can expect a reaction. It would most probably drop the price down and would touch the order block again as a test.

    MINA -1D

    When the price would touch the lower order block, we can look for a possible entry. This can be a long or a short depending on additional confluences. This 1D order block is very important and MINA should hold this level if it doesn’t want to fall even more.

    Price Prediction – Mina

    According to the traders, MINA is a good investment and is providing a great return. They think that soon MINA would be valued much more. On the other hand wallet investor considers MINA to be a bad investment and according to them, MINA would reach a value of  $0.696 in a single year.

  • Pancake Swap (CAKE) – Where to Now?

    At the time of writing this article, CAKE has a value of $11.80 (5.05% decreased today) with a trading volume of $163,511,459 with an increase of about 25.26% over the past 24 hours. The drop of BTC by 4% has once again dropped the altcoins as well.

    CAKE is listed on coinmarketcap in 54th place. It has a market dominance of 0.13%. CAKE had created its all-time high around the price of $44.28 in April 2021 and we saw an increase of about 125% that month. Soon after the price dropped to a level of $9.45. This month has been bearish for the price and we have seen a decrease of about 16.20% in December.

    The maximum supply of CAKE is around 247M and has the same current circulating supply which is around 247M coins.

    Technical Analysis – Pancake Swap (CAKE)

    CAKE has been one of the slow gainers and one of those coins that are bearish on the higher time frame. We can see that the price was respecting a trend line and it had bounced from there during the crash. But it failed to shift the structure on the higher time frame.

    It created a lower high and eventually came down to touch the trend line once again. It can be seen that for the past month, the price was printing red candles. As a result, we can see that the price, failed to hold the trend line and has broken below.

    CAKE -1W

    Now during this move which brought the price down, a weekly order block was created. This order block at the moment is unmitigated and as a result, this can be a reason for the price to move up now. If this happens then possible short positions can be opened at the order block, if we get the lower time frame confirmations for the reversal. Invalidation would be price going above and stabilizing itself from where we can look for a long position.

    Price Prediction – Pancake Swap

    According to wallet investor, CAKE is one of the most successful investments in the market. According to their predictions, CAKE is expected to reach a value of $30.618 in a time span of one year. For a five year $109.548. Investors think that it will soon reach the expected price though and we wouldn’t have to wait so much for the price to show big prices.

  • HIVE coin –  What is the Chart Showing Us?

    At the time of writing, HIVE is being traded at the price of $1.71. The price of HIVE has increased by almost 13.57% in the past 24 hours. The maximum and minimum of the day are around $1.84 and $1.46. The daily trading volume has also increased by almost 7.01% in one day. HIVE is listed on coinmarketcap at 121st spot according to market capital and has a market dominance of about 0.03%.

    HIVE before the crash had achieved its all-time high around the price of $1.050 in March 2021. During the crash, the price created a bottom and dropped down to $0.1652. As compared to other coins HIVE has been one of the fast gainers and it wasn’t long before it went on to create a new all-time high at the price of $3.4141 during the month of November

    The coin has a total supply of around 381M tokens and has the same amount of coins in circulation i.e. 381M. HIVE can be traded at a lot of different exchanges such as Binance, Mandela, Upbit, Huobi with different trading pairs.

    Technical Analysis – HIVE

    On the 4H time frame, we can see that HIVE had been moving in a descending channel for quite some time. The price was bearish after it failed to create a new higher high. Since then the price was respecting the trend line and we got to see it react to the trend line as well.

    After the sudden drop in the price of BTC, we saw a decrease in the price as well and a quick wick down was observed. This wick was quickly picked up by the traders and the price closed inside the trend line.

    HIVE -1D

    Now a point of interest is the order block that is created at the bottom. Even though, the price has grabbed the liquidity below. We can still expect this unmitigated area to drive the price down. As a result, if this level holds, we can look for a possible entry by taking into account other confluences as well.

    Price Prediction

    Hive (HIVE) has been one of the highly bullish coins in the market. According to wallet investor, in one year is expected to reach a value of $2.980. In five years, it is expected to touch $8.637. This is almost five times the current price.

  • Hathor (HTR) – Where to Now?

    At the time of writing this article, HTR has a value of $1.24 (8.83 increased today) with a trading volume of $15,270,501 with a decrease of about 6.49% over the past 35.14 hours. Today is a good day for the market and everything is back to green.

    HTR is listed on coinmarketcap in 268th place. It has negligible market dominance. HTR had created its all-time high around the price of $2.499 in November 2021 and we saw an increase of about 119%.  This month has been bearish for the price and we have seen a decrease of about 32.35% in December.

    The maximum supply of HTR is around 898M while the current circulating supply is around 222M coins.

    Technical Analysis – Hathor (HTR)

    On a daily time frame, we can see that HT was printing higher highs and higher lows. Before the highest wick, the price went and retraced back to create a lower low. The red zone marked was eventually a liquidity grab from the top. This liquidity was induced after the last higher high.

    After this scenario came to play. The market got the fuel to rally towards one side. This resulted in the fast drop towards the bottom side. The price eventually soon had a reaction from $1.2. From here the market started to rally up again. As a result, a lower low was created, since the market couldn’t break the structure.

    HTR -1D

    Now soon after that, the price started to drop again. This drop was triggered by the drop in the price of BTC. This drop brought the price down to the level of order block. HTR mitigated this level and went to rally up again. At this point, one might look for a possible long after the possible mitigation. But the price can drop again to test the level. As a result, we would have the additional confluence to the long position. Even though from here, the price can rally upwards without mitigating. A possible good strategy is to DCA if the price drops down and take profits on the way as the price rises to secure profits as well.

    Price Prediction – Hathor

    According to wallet investor, HTR is one of the most successful investments in the market. According to their predictions, HTR is expected to reach a value of $1.853 in a time span of one year. For a five year $8 soon and we wouldn’t have to wait so much for the price to show big prices.

  • Telcoin (TEL) gains almost 25% today – What Now?

    Telcoin (TEL) gains almost 25% today – What Now?

    At the time of writing TEL is being traded at the rate of $0.0129 with an increase of almost 25% within the last 24 hours.

    The low within this tenure was around $0.009901 and the high was approximately $0.01381. The coin as being in the watchlist of many traders makes it rank all the way up to number 114th according to the latest data released by coin market cap.

    TEL made its all-time high in the month of May 2021 where it reached an enormous amount of $0.0649. It later fell down to a price of $0.00918 during the crash from where it showed reversal. At the moment it has a daily volume of $27,466,501 with an increase of 143.41% within the last 24 hours. The circulating supply of TEL is now around 57.5B and the maximum supply is 100B. TEL has a dominance of 0.03%.

    The top exchanges for trading TEL are currently Kucoin, Uniswap.

    Technical Analysis – Telcoin

    TEL has been one of the slow gainers in the market. It had been slow gainers in the market. After it reached above $0.030 we saw a massive decline in the price of TEL and the downfall for the price started. Now the price tried to get out of this trend line but has been facing resistance and it would require a huge amount of volume.

    It can be seen that during the drop of BTC, we saw that the price of TEL hadn’t been affected much.

    TEL -1D

    If the price gets out of the descending channel, we can look for a possible entry at the retest of the price. Looking for additional confluences is important. If the price fails to break out and closes back in again, we can expect the price to go down even lower. Otherwise, we can expect a shot towards the upside with a possible target around the price of $0.02

    Price Prediction – Telcoin (TEL)

    Even though TEL has been one of the slow gainers and hasn’t been able to break out successfully. But in the long run, traders are highly bullish on the project. The price is currently at the same level where it was in July and has completely retraced back.  According to the wallet investor, the price of TEL is to reach a value of $0.0314 in a year. IN five years, it would reach around $0.112.

  • Ardor (ARDR) – Where will it move Now?

    Ardor (ARDR) – Where will it move Now?

    According to coinmarketcap, the total supply of ARDR is around 998M ARDR and all the coins of ARDR are in circulation at the moment. It holds the 191st rank according to market cap and has a market dominance of about 0.01%.

    At the time of writing ARDR is being traded at the price of $0.2689 with an increase of almost 13.08% in the last 24 hours. ARDR is a really strong token fundamentally. The maximum and minimum today are $0.294 and $0.2299 respectively. The daily trading volume has also increased by almost 43.95%. ARDR had created its ATH in April 2021 and reached a price of almost $0.79. The price later dropped down to a price of almost $0.08 in June 2021. Since then the price has shown reversal and has been on the same trajectory since then. The movement of coins has become slow and we have seen little to no gain last month. In December we have seen a drop of almost 26.19%.

    Technical Analysis – Ardor (ARDR)

    ARDR on the daily time frame was ranging very much. So zooming out to the higher time frames gave us a good outlook about how the price has reacted.

    On the weekly time frame, we can see that the price dropped down to create a bottom. The price showed reversal and within a few weeks, the price rallied upwards again. This resulted in the price nearly taking out its all-time high. But the price wasn’t able to support itself and the candle closed quite low.

    ARDR -1W

    Now the price has grabbed the liquidity and has the necessary fuel to move to the market. But the inefficiency in the candle can drive the price below. This can happen to some extent from where a possible entry or a long can be taken into consideration. On the other hand, the price can reverse from this level as well without feeling the need to go down for the mitigation.

    Price Prediction – Ardor (ARDR)

    According to wallet investor ARDR is a good investment and is providing a great return. According to them, ARDR is supposed to reach the value of $0.425 in a single year and in five years the price is expected to reach a value of $1.126. But people who trade are quite optimistic about the price and think that it would reach quite a high value.

  • What is dydx (DYDX) – The new Exchange Platform

    What is dydx (DYDX) – The new Exchange Platform

    The purpose is the same across all exchanging platforms. To create a system that attracts the largest number of users and makes them feel safe and in control of their assets, as well as to offer the financially disadvantaged the tools and products they need to conduct fair financial transactions. The dYdX platform is one platform that is working on this.

    Cryptocurrencies currently have the same monetary worth as actual money, thanks to their decentralized and privacy features. The aforementioned feature frightens regulatory authorities, especially those in first-world countries. As a result, a hostile environment has arisen around institutional perceptions of cryptocurrency. China is a recent example of a country that has outlawed all crypto-related activity.

    China is a huge market, and crypto took a hit as a result. However, the Chinese government’s tough stance merely encouraged investors to move their assets to a different platform, as “shutting down crypto” is nearly impossible. Nonetheless, decentralized financing (DeFi) products such as those offered by dYdX were the new direction in which the Chinese crypto-market evolved. This is evidenced in the fact that dYdX’s trading volume had surpassed that of Coinbase. That is significant. And, as the government continues to impose restrictions rather than embrace change, the move will become a common tendency among all types of investors.

    Price Movement

    At the time of writing DYDX is being traded at the price of $9.02 with an increase of almost 9.32% in the last 24 hours. DYDX is a really strong token fundamentally. The maximum and minimum today are $9.53 and $7.94 respectively. The daily trading volume has also decreased by almost 15.14%. The price had created its ATH in September 2021 and reached a price of almost $27.85. The next three months after September has been bearish. This month alone, we have seen a decrease of about 28.65%.

    Price Prediction – DYDX

    According to traders, we can expect growth in the price in the future. On the other hand,  wallet investor thinks that DYDX is a bad investment. According to them, in one year, DYDX would be worth around $0.439.

  • The p2p Decentralized File Sharing – BitTorrent (BTT)

    We use the internet to download data, files, executables, games, and a variety of other things. This information is maintained on a platform that people can access through a website. However, a new concept of peer-to-peer sharing has emerged, and it is becoming increasingly popular in recent days. This is where BTT comes in.

    What is BitTorrent, exactly?

    BitTorrent is a well-known example of a peer-to-peer (P2P) sharing website. The idea is that users share their own data with one another instead of relying on a central location. Torrent allows users to communicate with one another. Recently, the notion has been taken a step further by incorporating blockchain technology.

    In 2018, Tron purchased BitTorrent. It offers a slew of new features that make it easier to use a blockchain network. BTT is the native token, which was launched on Tron in accordance with TRC-10 regulations.

    The distribution of content on the internet and in real life is a huge issue. It is not possible to share expensive content with one another. As a result, no one can get it. BitTorrent’s goal was to disrupt the entire process and make it easier for people to access the content. As a result, BitTorrent is known for hosting illegal content and has been involved in numerous legal challenges over its operation.

    BitTorrent Software

    BitTorrent offers a variety of products, including BitTorrent Speed (for quicker downloads and incentives), dlive (for live streaming), and BitTorrent File System (for file sharing) (decentralized storage system). BitTorrent also provides premium services for customers who want to use VPN and have more privacy.

    Price Movement – BitTorrent (BTT)

    Before the crash, the coin had created its All-Time High in April 2021 and reached a price of almost $0.0135 before falling down to a price of $0.001775 in June 2021. At the time of writing this article BitTorrent (BTT) is being traded at a price of $0.003809. The price has almost increased by 20.37% today. In this month alone the price has increased by only 20%. BTT has been one of the slow gainers and is still hasn’t come close to its ATH.

    The Total volume at the moment is $3,397,238,474 with a decrease of 30.91% in the past 24 hours. The coin is listed on coinmarketcap on the 42nd spot and has a market dominance of about 0.16%.

    Long Term Price Prediction – BitTorrent (BTT)

    Wallet Investor thinks that BTT is a highly bullish coin and it would continue to rise in value. According to their prediction, in one year BTT will reach a value of $0.00571. In a five-year plan, the price is expected to reach a value of $0.0189. Traders think that it would soon reach the expected values in much less time.

  • Quant (QNT) – Where will it move Now?

    Quant (QNT) – Where will it move Now?

    According to coinmarketcap, the total supply of QNT is around 14.6M QNT and the circulating supply is around 12.07M QNT. It holds the 67th rank according to market cap and has a market dominance of about 0.08%.

    At the time of writing QNT is being traded at the price of $156.56 with a decrease of almost 16.68% in the last 24 hours. QNT is a really strong token fundamentally. The maximum and minimum today are $194.20 and $146.64 respectively. The daily trading volume has decreased by almost 11.30%. QNT had created its ATH in September 2021 and reached a price of almost $430. The price later dropped down to a price of almost $145. Since then the price has started moving downwards and has been on the same trajectory since then. The past three months have been bearish. In December, we saw a decrease of about 23.53% and in November, it was around 28.81%.

    Technical Analysis – Quant (QNT)

    If we see the monthly time frame, we can see that the price has very much retraced back to the origin. The gains that we have had to come to the all-time high have been retraced back in the past two months with almost 30% in both months.

    Now the price of QNT is at a very critical level. After the price rallied upwards (as can be seen in the chart), the price had created an order block.

    QNT - 1D

    Soon after the ATH, the price shifted the structure and started to drop down. It tried to break out at many levels. But eventually, it got rejected several times from the trend line. The drop of BTC was the final blow to the price and we saw the price to mitigate the order block that I have talked about before.

    Now if the price can hold this level, we can soon expect a shift in the structure and a surge in the price of QNT.

    Price Prediction – Quant (QNT)

    According to wallet investor QNT is a good investment and is providing a great return. According to them, QNT is supposed to reach the value of $509.29 in a single year and in five years the price is expected to reach a value of $1877. But people who trade are quite optimistic about the price and think that it would reach quite a high value.


  • Helium (HNT) –  What is the Chart Showing Us?

    At the time of writing HNT is being traded at the price of $29.85. The price of HNT has decreased by almost 11.57% in the past 24 hours. The maximum and minimum of the day are around $34.20 and $28.19. The daily trading volume has also decreased by almost 21.54% in one day. HNT is listed on coinmarketcap at 46th spot according to market capital and has a market dominance of about 0.14%.

    HNT before the crash had achieved its all-time high around the price of $23.90 in May 2021. During the crash, HNT created a bottom and dropped down to $8.30. As compared to other coins HNT has been one of the fast gainers and it wasn’t long before it went on to create a new all-time high at the price of $59.27 during the month of November

    HNT has a total supply of around 223M tokens and has a circulating supply of around 103.5M coins. HNT can be traded at a lot of different exchanges such as Binance, crypto.com, OKEx, Huobi with different trading pairs.

    Technical Analysis – Helium

    On higher time frames, it is quite interesting to note that a lot of altcoins have the same chart pattern. After the rally of BTC from 30k, the altcoins didn’t move much as they should have and BTC.d continued to rise. Now that BTC is taking a beating in the market, we can expect a lot of blood on the streets in regards to altcoins.

    HNT -1D

    HNT had created an order block, which was unmitigated. Soon the price rallied upwards and broke structure only to create a lower high. Just like many other coins, the price took a beating and dropped down really hard. Now it is near the order block. Even though, the price can reverse from here, as most of the gap has been filled. But some people would rather wait for the actual mitigation of the order block.

    If the price drops there, we can expect a possible long from there. In case BTC decides to drop down even further, we can expect more volatility.

    Price Prediction – Helium (HNT)

    Helium(HNT) has been one of the highly bullish coins in the market. According to the wallet investor, HNT in one year is expected to reach a value of $70.760. In five years, it is expected to touch $233.631.