Tag: Crypto

  • HIVE –  What is the Chart Showing Us?

    HIVE –  What is the Chart Showing Us?

    At the time of writing, HIVE is being traded at the price of $1.50. The price of the coin has decreased by almost 13% in the past 24 hours. The maximum and minimum of the day are around $1.74 and $1.50. The daily trading volume has on the other hand has also decreased by almost 19% in one day. HIVE is listed on coinmarketcap at 129th spot according to market capital and has a market dominance of 0.03%.

    HIVE before the crash had achieved its all-time high around the price of $1.050 in March 2021. During the crash, it created a bottom and dropped down to $0.16 in the month of June. Just like many other coins, the coin showed reversal and it was strong enough. HIVE eventually went on to create a new all-time high around the price of $3.411 during the month of November.

    HIVE has a total supply of around 383M tokens and has nearly all of them in the circulation i.ie around 383M. Ir can be traded at a lot of different exchanges such as Huobi, Binance, Uptbit, Gate.io.

    Technical Analysis – Hive

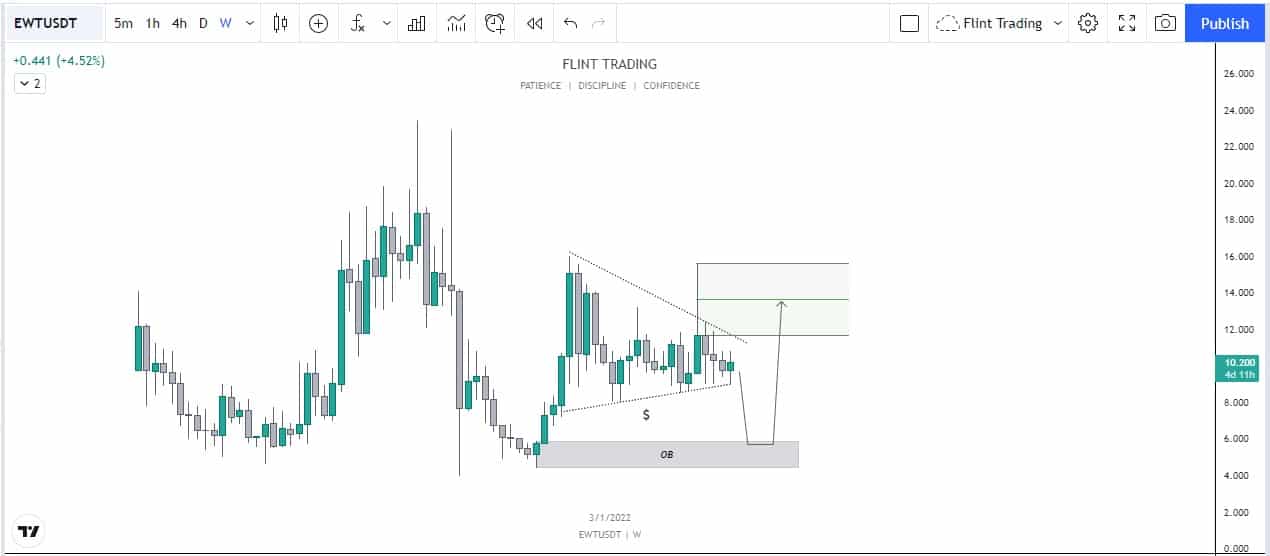
    We can see that HIVE has a really clean chart. The movement has been vigorous all the time and has seen no or little consolidation zones. We can see that the price of the coin had created a daily order block at the bottom. This happened when the price reversed and broke the lower high. The price failed to hold the last higher high and eventually fell down.

    HIVE - 1D

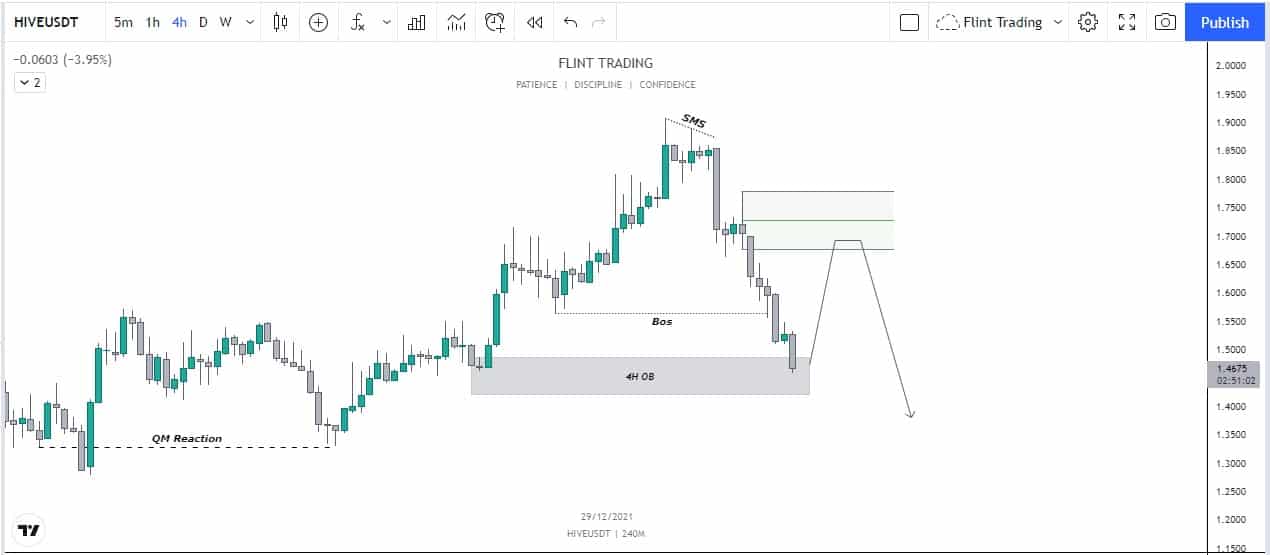
    The price fell down and broke the structure, this showed that the price has reversed the trend. Now the price has mitigated the order block. From here, we can expect a reaction from the price and we can expect the price to tap in the last higher high from where we can see that the price can eventually drop even lower.

    Price Prediction

    Hive has been one of the highly bullish coins in the market. According to wallet investor, HIVE in one year is expected to reach a value of $3.873. In five years, it is expected to touch $11.935. This shows that even though HIVE has a huge amount of potential in it and would give amazing returns but traders think that it wouldn’t be long before it reaches a new all-time high and starts trading above $10.

  • EVERSCALE (EVER) – Where is it?

    EVERSCALE (EVER) – Where is it?

    Everscale (EVER) is a novel blockchain concept that combines a scalable decentralized global computer with a distributed operating system. It is to create a scalable decentralized world computer.

    Everscale is built on the EVER OS platform. It can handle millions of transactions per second and includes Turing-complete smart contracts and decentralized user interfaces.

    Everscale (EVER) has some novel and unique features. This includes dynamic multithreading, soft majority consensus, and distributed programming. These features make it scalable, fast, and secure all at once. Through the Soft Majority Voting protocol. It is controlled by a decentralized community centered on meritocratic ideas.

    Everscale’s (EVER) developer tools include compilers for Solidity and C++, SDKs and APIs, client libraries ported to over 20 languages and platforms, and a variety of decentralized browsers and wallets that support a wide range of DeFi, NFT, tokenization, and governance applications.

    Price Movement Everscale (EVER)

    According to coinmarketcap, the total supply of the coin is around 2.03B coins and all of them around 735M of the EVER are in circulation at the moment. It holds the 268th rank according to market cap and has negligible market dominance.

    At the time of writing EVER is being traded at the price of $0.3751. The price has increased by almost 21.4% in the last 24 hours. The maximum and minimum today are $0.3754 and $0.2999 respectively. The daily trading volume has increased by almost 146%. It had created its ATH in December 2021 and reached a price of almost $0.3754. On the weekly time frame, we can see that overall the price of the coin is moving for higher highs. In November and December, we have seen a massive increase in the price of EVER as well as this week.

    Price Prediction – EVERSCALE

    EVER is a bad investment and is going to provide minimum returns. Wallet investor considers EVER to be a really bad investment as well. According to them, in a year the price is expected to reach a value of $0.0325. This means that according to them, it is a bad investment. Traders on the other hand are very bullish on the price. They think that it wouldn’t be long before EVER goes on to create a new ATH.

  • Energy Web Token (EWT) – Where to Now?

    Energy Web Token (EWT) – Where to Now?

    The native token of Energy Web Token is EWT

    At the time of writing, EWT is being traded at the rate of $10.40 with an increase of almost 8.85% within the last 24 hours.

    The low within this tenure was around $9.11 and the high was approximately $10.67. The coin as being in the watchlist of many traders makes it rank all the way up to number 174th according to the latest data released by coin market cap.

    EWT during the month of April approached its new All-time High around the price of $23.5. The trading volume today on the other hand has increased by almost 115.75%.

    The top exchanges for trading EWT are currently Kucoin, Gate.io, Kraken

    Technical Analysis –  Energy Web Token (EWT)

    EWT has quite an indecisive chart currently at the moment. We can see that the price before was coming down and creating lower lows. The price of EWT went up to create higher highs and higher lows. The price then created the highest point. This was the position when it failed to continue the trend and it started to fall down.

    The price started to fall vigorously down and with a wick down grabbed all the liquidity presented at the bottom. After this, the price continued the trend and dropped to the wick. This was the point when it showed reversal. During this reversal, the price created a daily order block as it broke the last structure.

    EWT - 1D

    After this, the price of EWT started to constraint itself as it went on to create a triangle. Now even though an equal triangle has the possibility of breaking out to even sides but the presence of an order block has given a weightage to the drop of the price.

    Now during the changing of the price, we need to take into account lower time confirmations to have a cleaner entry in the market as it is very indecisive.

    Price Prediction – Energy Web Token

    EWT has been one of the slow gainers in the market. The price is still way low as compared to the all-time high.  According to wallet investor, the price of EWT is to reach a value of $11.228 in a year. For five year plan, wallet investors think that the price is to reach a value of $17.973. This means that EWT is considered a good investment.

  • IOTA (MIOTA) – Where will it move Now?

    IOTA (MIOTA) – Where will it move Now?

    According to coinmarketcap, the total supply of MIOTA is around 2.78B MIOTA and all of them around 2.77B of the MIOTA are in circulation at the moment. It holds the 43rd rank according to market cap and has a market dominance of 0.17%.

    At the time of writing MIOTA is being traded at the price of $1.43 with an increase of almost 2.4% in the last 24 hours. The maximum and minimum today are $1.48 and $1.30 respectively. The daily trading volume has increased by almost 43.11%. MIOTA had created its ATH in April 2021 and reached a price of almost $2.7. The price during the crash dropped down to a price of almost $0.561 in the month of July 2021. Overall the price is moving to higher highs. In October, we saw an increase of almost 28.72%. This month, we have seen an increase of almost 0.20%.

    Technical Analysis – IOTA (MIOTA)

    IOTA has one of the cleanest charts that I have seen today. The price did an impulsive move upwards after which it started to come down. It can be seen that the price of IOTA has bounced from a point many times. After the first bounce, the price went up and touch the upper side of the channel. The price eventually broke the channel and came back to mitigate the order block that it had created beforehand.

    MIOTA - 1 D

    Now the price had broken down and mitigated the same level again. the price had a bounce from where it moved upwards. Now the price is in the same channel. The price for a few days has consolidated before a leg up. The price stayed for a while and eventually broke out moving towards the higher range. The final target can be the last higher high from where the price can eventually face resistance which can drop the price.

    Price Prediction – IOTA (MIOTA)

    MIOTA is a good investment and is going to provide great returns. Wallet investor considers MIOTA to be a really good investment as well. According to them, in a year the price is expected to reach a value of $2.27. In five years the price is expected to reach a value of $5.36. Traders on the other hand are very bullish on the price and think that it wouldn’t be long before MIOTA moves up to create a new ATH.

  • Immutable X (IMX) – Where to Now?

    Immutable X (IMX) – Where to Now?

    The native token of Immutable X is IMX

    At the time of writing, IMX is being traded at the rate of $5.09 with an increase of almost 4% within the last 24 hours.

    The low within this tenure was around $4.87 and the high was approximately $5.73. The coin as being in the watchlist of many traders makes it rank all the way up to number 96th according to the latest data released by coin market cap.

    IMX during the month of November approached a near All-time High around the price of $9.53. The trading volume today on the other hand has increased by almost 137.75%.

    The top exchanges for trading IMX are currently Kucoin, OKEx, FTX

    Technical Analysis –  Immutable X

    IMX before the consolidation had shown us higher high movements. The price printed a big green candle that took it to a new height. After that, IMX did a descending correction. This correction eventually led to the creation of a daily order block when the price shot up and broke the previous higher high. For some time, the price continued in this direction and we saw price achieve a new high a few weeks ago.

    Soon after, the price failed to create another high and eventually fell down to shift the structure. This also created another order block that has remained unmitigated for a long time. Now the price is doing a descending correction. Now the price is ranging between the two order blocks.

    IMX - 1D

    We can expect the price of IMX to mitigate the lower order block and then we can look for a long position. The price can drop down and get a bounce from the support, this would make sure that there is no reason for the price to go down again. Then we can look for a possible long position, this would take the price of IMX to mitigate the upper order block from where a reaction can be expected. Depending on the lower time frame confirmations, we can look for a cleaner entry.

    Price Prediction – Immutable X (IMX)

    IMX has been one of the slow gainers in the market. The price is still way low as compared to the all-time high.  According to wallet investor, the price of IMX is to reach a value of $0.919 in a year. This means that wallet investor considers IMX to be a bad investment.

  • Zilliqa (ZIL) –  What is the Chart Showing Us?

    Zilliqa (ZIL) –  What is the Chart Showing Us?

    At the time of writing, ZIL is being traded at the price of $0.07812. The price of the coin has decreased by almost 5.42% in the past 24 hours. The maximum and minimum of the day are around $0.08452 and $0.07383. The daily trading volume has on the other hand has also decreased by almost 17% in one day. ZIL is listed on coinmarketcap at 97th spot according to market capital and has a market dominance of 0.04%.

    ZIL before the crash had achieved its all-time high around the price of $0.256 in May 2021. During the crash, it created a bottom and dropped down to $0.050 in the month of July. Just like many other coins, the coin showed reversal but it wasn’t strong enough. ZIL ultimately dropped down even the monthly low of July and is showing weakness.

    ZIL has a total supply of around 21B tokens and has nearly half of them in the circulation i.ie around 12.1M. ZIL can be traded at a lot of different exchanges such as KuCoin, Binance, Hotbit, HitBTC.

    Technical Analysis – Zilliqa (ZIL)

    ZIL has shown weakness even when it was in the uptrend. We can see that prior to the drop in the price and the shift in the structure, the price was moving in the uptrend. But the creation of higher highs and higher lows was very slow.

    Ultimately the structure broke and the price started to create lower lows and lower highs. The price was moving in the downward channel. ZIL at this point started to show strength and the shift in the structure became obvious. This happened when the price started to consolidate and built a base at the bottom.

    ZIL - 1D

    Now there are two points of interest. One is the equilibrium of the consolidation and the other one is the last lower high. We can expect the price to touch the breaker, drop down to touch the middle point of consolidation, and then a long upwards.

    Price Prediction – Zilliqa

    Zilliqa (ZIL) has been one of the highly bullish coins in the market. According to wallet investor, ZIL in one year is expected to reach a value of $0.156. In five years, it is expected to touch $0.450. This shows that even though ZIL has a huge amount of potential in it and would give an amazing return but according to this estimate, it would take 5 years to reach the current ATH.

  • Axie Infinity (AXS) – What is the Chart Showing Us?

    Axie Infinity (AXS) – What is the Chart Showing Us?

    At the time of writing AXS is being traded at the rate of $105.07 with a decrease of almost 4% within the last 24 hours.

    The low within this tenure was around $101.81 and the high was approximately $111.60. The coin as being in the watchlist of many traders makes it rank all the way up to number 30th according to the latest data released by coin market cap.

    AXS made its all-time high in the month of October 2021 where it reached an enormous amount of $166.09. At the moment it has a daily volume of $338,382,094 with an increase of about 41% within the last 24 hours. The total supply of AXS is now around 270M and the circulating supply is also 60.9M. AXS has a dominance of 0.28%.

    The top exchanges for trading it are currently Binance, OKEx, FTX.

    Technical Analysis – Axie Infinity (AXS)

    AXS has been one of the top gainers at one point. The price of AXS has been going upwards and printing green candles. This resulted in the formation of higher highs and higher lows. The price of AXS ultimately shifted the structure which resulted in the drop in the price of the coin.  This drop in the price or should I say a descending correction was very systematic and the price was following a trend line. The price has respected this trend line on many occasions and has been rejected from there at two different points.

    AXS - 1D

    The price ultimately dropped down and touched the bottom from where it started to move upwards but once again, it got rejected from the trend line which resulted in a red candle. Now the price can drop down to the lower order block as shown in the chart as it is still unmitigated. Lower time frame confirmations should be taken into consideration to have a cleaner entry.

    Price Prediction – Axie Infinity (AXS)

    AXS has been one of the most successful and powerful coins. The people have gained a lot, based on this coin. In the long run, traders are highly bullish on the project. The price of AXS has retraced back and is around the same price it had around the month of October. According to the wallet investor, AXS is a good investment. The price of the coin is to reach a value of $331.629 in a year. In five years, the price is expected to reach around $1222.640.

  • What is Loorping (LRC) –  How does it Work?

    What is Loorping (LRC) –  How does it Work?

    In finance, decentralized finance is the way of the future (DeFi). We have already developed the technology that will underpin the financial industry’s future, which includes blockchain and cryptography. To pass through the tunnel that will lead us to the revolution, specific procedures and infrastructure are now required. Loopring (LRC) is working towards this goal.

    Ethereum, particularly layer 2, is expected to be the cornerstone for the future of marketing, according to the company (zkRollups). According to Looper (LRC), DeFi users now have a fantastic option for building low-cost, high-speed platforms for trading, exchanging, liquidity provisioning, and payments – all while maintaining Ethereum security. The objective of Loopring is to build the best zkRollup exchange and payment system on Ethereum, as well as to run products that make it available to users all over the world.

    They provide 100% Ethereum-level security, ensuring Loopring’s (LRC) safety. This implies it doesn’t rely on validators, consensus, or cryptoeconomic assumptions at all, instead of relying only on Ethereum and Zero Knowledge cryptography.cry

    So, what does it mean to have “zero knowledge” (zk)? In a fast and secure gas-free channel, users can deposit and withdraw Ethereum-based assets. If you’ve been following crypto, you’re aware that switching to real-world transactions will have enormous ramifications and cause major headaches.

    We may also be able to say goodbye to the scalability issue, according to Looper. In more basic words, the zkRollup throughput Loopring (LRC) achieves roughly 1000x the speed of Ethereum trades, or about 2,025 deals per second or higher.

    Price Movement

    Before the crash in May, the coin was being traded at the price of $0.910 It later fell down to the price of $0.18. The price was very fast to move upwards and quickly reached new heights. At the time of writing this article, The Loopring (LRC ) is being traded at a price of $2.20. The price has almost decreased by 10% today. On the monthly time frame, we have seen a decrease of almost 20%.

    Price Prediction – Loopring  (LRC)

    In the long run, LRC is a highly good opportunity. According to the wallet investor, the price of LRC is to reach a value of $3.512 in a year. For a five-year plan, the price will reach a value of $8.025. The way the price of LRC has grown, the traders are even more bullish on the value and they think that it will reach even more.

  • What is Filecoin (FIL) – How does it work?

    What is Filecoin (FIL) – How does it work?

    New paths for technology and innovation have opened up with the introduction of blockchain technology. The storing of files over the internet is one of these innovations. Nobody, on the other hand, would want to store someone else’s files out of the goodness of their hearts. So Filecoin (FIL), a peer-to-peer network that stores files on the internet with built-in economic incentives to ensure files are stored stably over time, enters the picture.

    Because the entire method is carried out via blockchain technology, the available storage and pricing are not controlled by any single organization or entity but are open to anybody.

    Users of Filecoin (FIL) pay to have their data stored on storage miners. These miners are computers that are in charge of keeping files and demonstrating that they have been saved correctly over time. Through Filecoin, anyone can have their data stored, and others can be compensated for doing so. The protocol’s native coin is FIL, which is obtained by storing the coin by storage miners.

    All of this is accomplished by Web3’s system being built on the web3.

    Filecoin (FIL) is based on a peer-to-peer network in which peers communicate over secure channels to broadcast information to the network and move data amongst themselves. The clients, also known as nodes, are responsible for verifying the Filecoin blockchain and validating the messages in each block. Filecoin wallets can be managed and FIL received by nodes. Nodes can also make storage (agreements between clients and storage miners to store data) and retrieval (agreements between clients and retrieval miners to extract data from the network) deals with Filecoin miners and pay for them as they are completed. The miners here are in charge of executing various “deals” and creating new blocks.

    Price Movement

    At the time of writing, FIL is being traded at the price of $38.05 with an increase of almost 1.72% in the last 24 hours. FIL is a really strong token fundamentally. The maximum and minimum today are $41.13 and $37.25respectively. The daily trading volume has increased by almost 200%. FIL had created its ATH in October 2020 and reached a price of almost $430. After the reversal, FIL had achieved a massive value in September and got to the value of $120. FIL has a circulating supply of almost 142M coins and a total supply of almost 140M. It is listed on coinmarketcap at rank 36th. It can be exchanged on Binance, FTX, Huobi Global.

    Price Prediction – Filcoin (FIL)

    According to wallet investor thinks that FIL is a good investment. According to them, in one year, FIL would be worth around $58.05. In five years, the price is expected to reach a value of $143.215.

  • The Token of Crypto.com (CRO)

    The Token of Crypto.com (CRO)

    The cryptocurrency market is exploding. Some people see it as a way to make money. Others see it as the world’s future. Regardless of what vision is guiding these individuals’ perspectives, cryptocurrencies are emerging one after the other, and a framework for the smooth exchange of these coins must be created. The most well-known of these is Binance. One would believe that Binance is the sole site where these coins can be traded. However, there are some alternatives to this trade. Crypto.com and its utility currency, crypto.com coin or CRO, are the ones we’ll be focusing on.

    Crypto.com is a community attempting to create a community for the Web3, the internet’s future. They believe that by utilizing cryptocurrency, Web3 will become a fairer and more egalitarian network that is owned by builders, artists, and users.

    The first step they took to achieve their objectives was to grow their ecosystems and make it easier for developers to join their exchange. In addition, crypto.com has created CRO, a coin meant to help cryptocurrencies become more widely accepted as a payment mechanism. The Ethereum blockchain was used to create the CRO coin. Certik audited it on November 9, 2018, with the goal of determining whether verified smart contracts are secure enough to avoid exploitable weaknesses.

    Water.org, a non-profit organization dedicated to delivering clean and safe drinking water, has also received a donation of roughly a million dollars from crypto.com. Although philanthropic initiatives appear to benefit people, they are also intended to engage the millennial demographic, which admires such efforts.

    Price Movement

    At the time of writing CRO is being traded at the price of $0.6395 with an increase of almost 11.55% in the last 24 hours. CRO is a really strong token fundamentally. The maximum and minimum today are $0.6517 and $0.5705 respectively. The daily trading volume has increased by almost 125%. CRO had created its ATH in July 2020 and reached a price of almost $2. After the reversal, CRO had achieved a massive value in November and got to the value of $0.975. CRO has a circulating supply of almost 25.26B coins and a total supply of almost 30.23B. It is listed on coinmarketcap at rank 15th. It can be exchanged on Binance, FTX, Huobi Global.

    Price Prediction – Crypto.com (CRO)

    According to wallet investor thinks that CRO is a good investment. According to them, in one year, CRO would be worth around $0.781. In five years, the price is expected to reach a value of $1.887.