Tag: Crypto

  • Bitcoin Cash (BCH) – What is the Chart Showing Us?

    Bitcoin Cash (BCH) – What is the Chart Showing Us?

    At the time of writing, BCH is being traded at the rate of $453.40 with an increase of almost 2.5% within the last 24 hours.

    The low within this tenure was around $442.20 and the high was approximately $460.98. The coin as being in the watchlist of many traders makes it rank all the way up to number 25th according to the latest data released by coin market cap.

    BCH made its all-time high in the month of May 2021 where it reached an enormous amount of $1650. At the moment it has a daily volume of $5,376,565,254 with an increase of about 8% within the last 24 hours. The total supply of BCH is now around 21M and the circulating supply is also 18.9M. BCH has a dominance of 0.36%.

    The top exchanges for trading it are currently Binance, Kucoin, Gate.io.

    Technical Analysis – Bitcoin Cash (BCH)

    It can be seen that BCH has had a reaction from the Quasimodo levels. The price had a break of structure towards the downside. We can see that the price of BCH had been bearish for a lot of time.

    The price of the coin started doing a descending correction. At this point, people were hoping for a short and a lot of positions must have been opened. The price has broken out of the correction and we can look for a retest.

    BCH - 1D

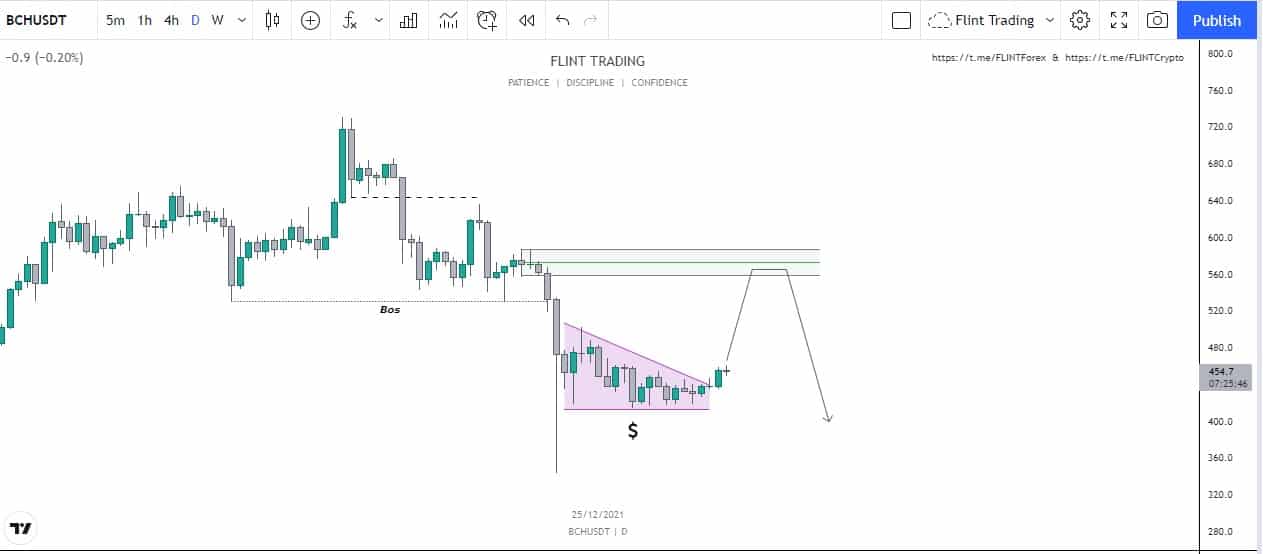
    The price at this point can come down to retest the trend line after which we can look for a long position to the order block. When the price reaches the order block, we can look for a reaction from the price. If it fails to hold then BCH can drop down again as there is liquidity present as well. If the price manages to stay above the level, we can look for a possible long.

    Price Prediction – Bitcoin Cash (BCH)

    BCH has been one of the most successful and powerful coins. The people have gained a lot, based on this coin. In the long run, traders are highly bullish on the project. The price of BCH has retraced back and is around the same price it had around the month of June. According to the wallet investor, BCH is a good investment. The price of the coin is to reach a value of $734.247 in a year. In five years, the price is expected to reach around $1816.510.

  • SushiSwap (SUSHI) –  What is the Chart Showing Us?

    SushiSwap (SUSHI) –  What is the Chart Showing Us?

    At the time of writing SUSHI is being traded at the price of $7.70. The price of the coin has increased by almost 13.28% in the past 24 hours. The maximum and minimum of the day are around $7.80 and $6.89. The daily trading volume has on the other hand has also increased by almost 20% in one day. SUSHI is listed on coinmarketcap at 96th spot according to market capital and has a market dominance of 0.04%.

    SUSHI before the crash had achieved its all-time high around the price of $23.430 in March 2021. During the crash, SUSHI created a bottom and dropped down to $5.96 in the month of July. Just like many other coins, the coin showed reversal but it wasn’t strong enough. SUSHI ultimately dropped down even the monthly low of July and is showing weakness.

    SUSHI has a total supply of around 250M tokens and has nearly half of them in circulation i.ie around 127M. The coin can be traded at a lot of different exchanges such as KuCoin, Binance, Hotbit, FTX.

    Technical Analysis – SushiSwap (SUSHI)

    Sushi on the weekly time frame has been bearish since the crash in July. During that time, the coin did try to move up but it failed and eventually dropped down to an even lower value than it had during the month of July.

    We can see that on the weekly time frame, the coin has made a momentous candle and has no sign of weakness. It can be seen that there is an order block that has been formed. This order block is unmitigated till date.

    SUSHI - 1D

    Now we can expect the price to move up and tap the order block. From there, we can expect a reaction. If the price fails to hold then we can drop down to the black line as shown in the chart. Otherwise, we can move up and touch the half point of the giant wick.

    Price Prediction – SushiSwap (SUSHI)

    SushiSwap(SUSHI) has been one of the highly bullish coins in the market. According to wallet investor, SUSHI in one year is expected to reach a value of $10.920. In five years, it is expected to touch $32.618. This shows that even though SUSHI has a huge amount of potential in it and would give amazing returns but according to this estimate, it would take 5 years to reach the current ATH.

  • Fantom (FTM) – On its way to $3?

    Fantom (FTM) – On its way to $3?

    The native token of Fantom Opera is FTM

    At the time of writing, FTM is being traded at the rate of $2.02 with an increase of almost 16% within the last 24 hours.

    The low within this tenure was around $1.73 and the high was approximately $2.08. The coin as being in the watchlist of many traders makes it rank all the way up to number 39th according to the latest data released by coin market cap.

    FTM during the month of October approached a near All-time High around the price of $3.48. The trading volume today on the other hand has increased by almost 17.75%.

    The top exchanges for trading FTM are currently Binance, OKEx, FTX

    Technical Analysis –  Fantom (FTM)

    Fantom Opera (FTM) had been one of the most bullish coins in the market. The dip of Fantom was quickly bought and now we have seen a massive increase in the price of Fantom. After the creation of ATH, the price dropped down as it failed to hold the level. It started creating lower highs and lower lows. The price soon after creating an order block that happened with the impulsive move downwards. Now, this order has remained unmitigated for a long time.

    FTM - 1D

    Now the price of FTM has shown reversal, we can see that the price has printed many green candles. These candles are very momentous and this has been happening for the past four days. Now the price is tapping in a very important zone. The price might drop from this zone and tap the liquidity present below. The second option is that the price will go upwards and mitigate the order block that is present above. In both cases, we must look into the lower time frame confirmations to have a cleaner entry into the market.  A better way is to book profits all the way to the point where there is a lack of momentum. If it drops you can buy more with the profit you have secured.

    Price Prediction – Fantom (FTM)

    FTM has been one of the slow gainers in the market. The price is still way low as compared to the all-time high.  According to wallet investor, the price of FTM is to reach a value of $3.518 in a year. In five years, the price is expected to reach a value of $11.955.

  • Dogelon Mars (ELON) – Where will it move Now?

    Dogelon Mars (ELON) – Where will it move Now?

    According to coinmarketcap, the total supply of ELON is around 1000T ELON and around 556B of the ELON are in circulation at the moment. It holds the 95th rank according to market cap and has a market dominance of 0.04%.

    At the time of writing ELON is being traded at the price of $0.000001761 with an increase of almost 24% in the last 24 hours. The maximum and minimum today are $0.000001868 and $0.000001523 respectively. The daily trading volume has increased by almost 181.28%. ELON had created its ATH in October 2021 and reached a price of almost $0.000002670. The price during the crash dropped down to a price of almost $0.000000042 in the month of July 2021. Overall the price is moving to higher highs. In October, we saw an increase of almost 4100%. This month, we have seen an increase of almost 4.10%.

    Technical Analysis – Dogelon Mars (ELON)

    Dogelon Mars has gained almost 4000% in October. After the gain, the price did a descending correction. The momentum broke down and ELON grabbed the liquidity present below with a fast wick down. The price did show strength at that point, but eventually,  it dropped down and started to make lower lows and lower highs.

    The price started to become constricted and eventually broke out that resulting in the price moving upwards. Now it can be seen that there is an order block present above and liquidity as well. Both features can be a reason to drive the price upwards.

    ELON -1D

    When it happens, we can look for a reaction there. Most probably, ELON is going to face resistance and this would result in a drop in the price. Lower time frame confirmations should be taken into consideration to have a cleaner entry into the market.

    Price Prediction – Dogelon Mars (ELON)

    ELON even though is a meme coin. It is a good investment and is going to provide great returns. Wallet investor considers ELON to be a really good investment as well. According to them, in a year the price is expected to reach a value of $0.000003. In five years the price is expected to reach a value of $0.000009. Traders on the other hand are very bullish on the price and think that it wouldn’t be long before ELON moves up to create a new ATH.

  • What is Yearn.Finance (YFI) and How does it Work

    What is Yearn.Finance (YFI) and How does it Work

    We have several dApps in the area of decentralized finances (defi) via which customers can potentially obtain maximum profits. Sometimes this is done by giving liquidity, and other times it is done via staking. But, if we’re being honest, just a small percentage of the population comprehends how the world works. YFI is one of such platform.

    What is Yearn Finance (YFI)?

    Yearn finance is a website that helps its users make the most money possible by automating the process of yield farming. The platform’s goal is to work in such a way that it simplifies the defi world for those who have the money to invest but lack the technical skills to grasp how it works.

    Yearn finance was started in February and was formerly known as iEarn before being renamed Yearn.finance. Since then, the corporation has experienced tremendous growth and has amassed enormous worth. Total value locked (TVL) assets are expected to be approximately $1 billion by 2020, according to coinmarketcap.

    How does it Work?

    The platform employs proprietary techniques and operates as an aggregator to provide investors with the highest possible income via DeFi protocols such as AAVE, COMP, and Curve.

    Yearn.finance (YFI) offers two primary services.

    Vault: It is a passive income method for individuals that generate income depending on market opportunities. It is accomplished by automating the yield production, rebalancing, and capital movement processes.

    Earn: As the interest rate changes, the money is transferred between AAVE, COMP, and dYdX, giving the users the highest possible yield.

    Price Movement

    At the time of writing YFI is being traded at the price of $32,063 with a decrease of almost 5% in the last 24 hours. YFI is a really strong token fundamentally. The maximum and minimum today are $33,520 and $31,258 respectively. The daily trading volume has decreased by almost 25%. YFI had created its ATH in May 2021 and reached a price of almost $95k. Even after the reversal, YFI still hasn’t been able to recover from the damage and is trading at the price it had around March.

    YFI has a circulating supply of almost 36,666 coins and a total supply of almost 36,666. It is listed on coinmarketcap at rank 85th. It can be exchanged on Binance, FTX, Huobi Global.

    Price Prediction – Yearn.Finance (YFI)

    According to wallet investor thinks that YFI is a bad investment. According to them, in one year, YFI would be worth around $17,068. This means that according to them, a wallet investor is a bad investment.

  • Klaytn (KLAY) – Public Blockchain

    Klaytn (KLAY) – Public Blockchain

    Klaytn (KLAY) is a global public blockchain platform created by Ground X, a blockchain subsidiary of Kakao, a leading South Korean Internet corporation. Klaytn is a service-oriented blockchain platform with an easy-to-use development environment and a welcoming user interface. It is based on a firm foundation of dependability and stability, as well as extensive service development for widespread adoption. The platform enables large-scale real-world applications to be created immediately, allowing our end-users to take full advantage of services without requiring extensive knowledge of blockchain or cryptocurrencies.

    How does Klaytn (KLAY) Operate?

    Klaytn uses a hybrid approach that combines the best of both worlds, with decentralized data and control, distributed governance, and low latency and high scalability, which are key advantages of public blockchains, and low latency and high scalability, which are key elements of private blockchains. Furthermore, Klaytn (KLAY) is safeguarded by the involvement of a number of well-known brands from around the world, all working together to build a secure business platform based on a decentralized trust system. Blockchain Applications (bApps) are considered first-class citizens in Klaytn’s vision. They strive to give the highest level of performance and efficiency in an atmosphere that appeals to a variety of audiences, ranging from little businesses to major enterprises. Designers of bApps are free to provide their clients with the greatest possible experience.

    Goals of Klaytn (KLAY)

    It also contains three logical subnetworks based on its goals and functions. The first is the Network of Core Cells (CCN), which verifies and executes Endpoint Node transactions (ENs). The ENs are in charge of generating transactions, handling RPC API calls, and processing data requests from service chains in the Network of Endpoint Nodes (ENN). Finally, there’s the Network of Service Chains (SCN), which are subnetworks comprised of auxiliary blockchains that are run independently by blockchain apps (bApps) on KLAY.

    Price Movement

    Before the crash in June, the coin was being traded at the price of $1.56. It later fell down to the price of $0.824. The price quickly moved upwards and created a new all-time high around the price of $4.40. This happened in the month of October. At the time of writing this article, The KLAYTN (KLAY ) is being traded at a price of $1.30. The price has almost increased by 1.50% today. On the monthly time frame, we have seen a decrease of almost 7%.

    Price Prediction – Klaytn (KLAY )

    In the long run, KLAY is a highly good opportunity. According to the wallet investor, the price of KLAY is to reach a value of $1.863 in a year. For a five-year plan, the price will reach a value of $4.388. The way the price of KLAY has grown, the traders are even more bullish. They think the value will reach even more.

  • Solana (SOL) – What is the Chart Showing Us?

    Solana (SOL) – What is the Chart Showing Us?

    At the time of writing SOL is being traded at the rate of $179.26 with a decrease of almost 1.5% within the last 24 hours.

    The low within this tenure was around $176.12 and the high was approximately $186.14. The coin as being in the watchlist of many traders makes it rank all the way up to number 5th according to the latest data released by coin market cap.

    SOL made its all-time high in the month of November 2021 where it reached an enormous amount of $259.90. At the moment it has a daily volume of $1,693,630,940 with a decrease of about 6.71% within the last 24 hours. The total supply of SOL is now around 511M and the circulating supply is also 308M. It has a dominance of 0.09%.

    The top exchanges for trading it are currently Binance, Kucoin, Gate.io.

    Technical Analysis – Solana (SOL)

    Solana (SOL), the coin that took over the internet has been one of the highest gainers in the market at one point. Just like everything else, the price dropped down and started to create lower lows and lower highs. The price of SOL showed reversal when it failed to create another higher high. SOL had also grabbed liquidity present above which had also provided it with the necessary fuel to drop the price. This left inefficiency in the price which now can drive the price upwards.

    SOL - 1D

    Now the price has shown reversal, we can expect SOL to rise up and touch the inefficiency point to fill the gap. From there we can expect a reaction. If the price holds the level, we can expect a higher high. In case the price fails to hold, SOL can drop once again. This would lead the price to the last breaker at which the price had shown reversal before.

    Price Prediction – Solana (SOL)

    SOL has been one of the most successful and powerful coins. The people have gained a lot, based on this coin. In the long run, traders are highly bullish on the project. The price of SOL has retraced back and is around the same price it had around the month of October. According to the wallet investor, SOL is a good investment. The price of the coin is to reach a value of $551.524 in a year. In five years, the price is expected to reach around $2042.730.

  • Dogecoin (DOGE) –  What is the Chart Showing Us?

    Dogecoin (DOGE) –  What is the Chart Showing Us?

    At the time of writing, DOGE is being traded at the price of $0.1767. The price of the coin has increased by almost 3% in the past 24 hours. The maximum and minimum of the day are around $0.1789 and $0.1713. The daily trading volume has on the other hand has also increased by almost 55% in one day. DOGE is listed on coinmarketcap at 12th spot according to market capital and has a market dominance of 1.03%.

    DOGE before the crash had achieved its all-time high around the price of $0.74 in May 2021. During the crash, DOGE created a bottom and dropped down to $0.1599 in the month of July. Just like many other coins, the coin showed reversal but it wasn’t strong enough. DOGE is still being traded at the price it had around July and this month even went lower than that.

    It has a total supply of around 132B tokens and has nearly all of them in circulation i.ie around 132B. DOGE can be traded at a lot of different exchanges such as KuCoin, Binance, Hotbit, FTX.

    Technical Analysis – Dogecoin (DOGE)

    Dogecoin, the meme that took over the internet has been one of the highest gainers in the market at one point. ON the weekly time frame, it can be seen the price had gone on to create an all-time high a few months back. We can see that an order block had been created that lies below. If we notice, we can see that price of the coin had created an order block that lies on the floor and this order block has remained unmitigated for a long time.

    DOGE -1 D

    With the losing momentum, we can expect a drop in the price to the bottom and mitigate the order block. From there, we can look for a reversal. This reversal would drive the price upwards with the final targets that have been marked on the chart as well.

    Price Prediction – Dogecoin (DOGE)

    Dogecoin(DOGE) has been one of the highly bullish coins in the market. According to wallet investor, DOGE in one year is expected to reach a value of $0.388. In five years, it is expected to touch $1.254. This shows that DOGE has a huge amount of potential in it and would give an amazing return to the people who would hold it.

  • Uniswap (UNI) – On its way to $20?

    Uniswap (UNI) – On its way to $20?

    The native token of Uniswap DEX is UNI

    At the time of writing, UNI is being traded at the rate of $16.84 with an increase of almost 12% within the last 24 hours.

    The low within this tenure was around $15.03 and the high was approximately $17.09. The coin as being in the watchlist of many traders makes it rank all the way up to number 19th according to the latest data released by coin market cap.

    UNI during the month of May approached a near All-time High around the price of $45. The trading volume today on the other hand has increased by almost 200%.s

    The top exchanges for trading UNI are currently Binance, OKEx, FTX

    Technical Analysis –  Uniswap (UNI)

    UNI has been of the slow coins to move. On the chart, we can see that the price UNISWAP had been creating a higher high and higher low. But it can be seen that the structures didn’t have many differences in terms of values. It looked like as it was in a consolidation phase on a major time frame.

    The chart shows that the price of Uniswap (UNI) started to lose momentum and slowly started to fall. It soon broke the previous structure. This break of the structure was pivotal to show the direction of the movement.

    UNI - 1D

    The price of UNI fell down by printing two massive red candles. The second one had a huge wick which grabbed the liquidity below present below.  The price did have a reversal but it wasn’t strong enough to create a reversal in the pattern.

    Now an important point of interest is the presence in the order block. We can expect the price to show a reversal from this point. This can drive the price upwards and we can touch the daily order block. If the price becomes stable above it, we can look for a higher high. If the price fails to hold the level, this would drop UNI down. Lower time frame confirmations should be taken into consideration to have a cleaner entry.

    Price Prediction – Uniswap (UNI)

    UNI has been one of the slow gainers in the market. The price is still way low as compared to the all-time high.  According to wallet investor, the price of UNI is to reach a value of $29.694 in a year. In five years, the price is expected to reach a value of $88.806.

  • Kusama (KSM) – Where will it move Now?

    Kusama (KSM) – Where will it move Now?

    According to coinmarketcap, the total supply of KSM is around 9.6M KSM and around 8.47M of the KSM are in circulation at the moment. It holds the 60th rank according to market cap and has a market dominance of 0.10%.

    At the time of writing, KSM is being traded at the price of $273.01 with an increase of almost 0.57% in the last 24 hours. The maximum and minimum today are $280.56 and $267.95 respectively. The daily trading volume has increased by almost 22.38%. KSM had created its ATH in May 2021 and reached a price of almost $625. The price during the crash dropped down to a price of almost $142 in the month of July 2021. Overall the price is moving to higher highs. In November, we saw an increase of almost 6%. This month, we have seen a decrease of almost 30.31%.

    Technical Analysis

    We can see that Kusama has been bullish at one point. The price was creating higher highs and higher lows. Soon after, the price of KSM failed to create another high and confirmed the reversal in the structure. This lead to a drop in the price.

    A point of interest is the daily order block that has been created above the current price. This happened when the drop in the price started to happen and we saw massive red candles getting printed.

    KSM - 1D

    After the drop, the price of KSM went into a descending correction. Now we can expect is that the price can move out of this descending correction. From there, we can look for a retest. If the retest holds, we can expect a move towards the daily order block. When the price reaches that point, we can expect a reaction from the price. If it holds, the price can have a shot towards the last higher high.

    Price Prediction – Kusama (KSM)

    KSM is a good investment and is going to provide great returns. Wallet investor considers KSM to be a really good investment as well. According to them, in a year the price is expected to reach a value of $576.134. In five years the price is expected to reach a value of $1771.100. Traders on the other hand are very bullish on the price and think that it wouldn’t be long before KSM moves up to create a new ATH.