Tag: Crypto

  • KuCoin Token (KCS) – Where will it go Now?

    KuCoin Token (KCS) – Where will it go Now?

    KuCoin Token (KCS) is the native token of KuCoin exchange that is used for a variety of purposes.

    At the time of writing this article, KCS has a value of $20.71 (0.11% increase today) with a trading volume of $13,471,492, with an increase of about 7% over the past 24 hours.

    KCS is listed on coinmarketcap in the 71st place. It has a market dominance of about 0.07%. KCS had created its all-time high around the price of $28.776 in December 2021 and later fell down to the price of $17.816 in the same month.  This month has been bearish for the price and we have seen a decrease of about 22.5% in December. November was however very bullish for the price and we saw an increase of about 47.12% in the price.

    The maximum supply of KCS is around 170M while the current circulating supply is around 80.1M coins.

    Technical Analysis – KuCoin Token (KCS)

    On the daily time frame, we can see that the price in the past had created an order block in the past. This was created when the price broke the last structure. This order block has been unmitigated for a long time.

    The price of KCS was consolidated for a long time and eventually did a fake-out which resulted in the drop in price. The price had dropped down to mitigate the order block. It can be seen that the price dropped for five-six consecutive days.

    KCS - 1D

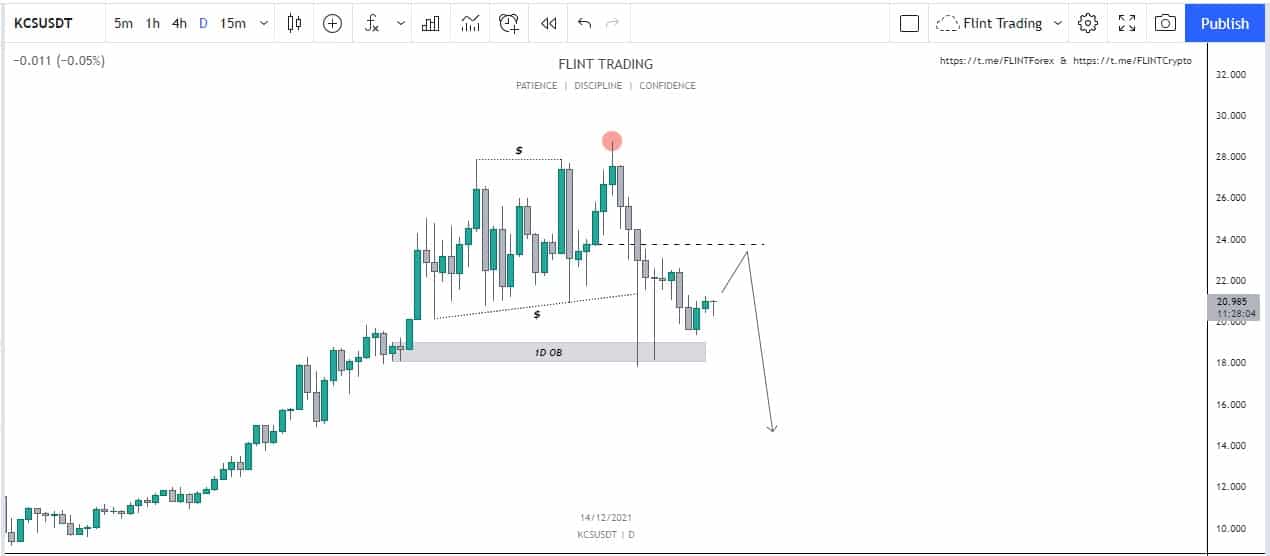
    The price fell down to mitigate the order block. Now there is two points of interest that should be taken into notice. One is the equilibrium point of the consolidation zone. The second is the lower values of the price. This middle point can drive the price upwards from where we can expect a possible reaction. If the price becomes stable above, we can look for a higher high in the price. If the price fails to hold this level, chances are that we will go down to an even lower value in the price.

    Price Prediction – KuCoin Token(KCS)

    According to wallet investor, KCS is one of the most successful investments in the market. According to their predictions, KCS is expected to reach a value of $39.80 in a time span of one year. For a five year plan, the price is expected to reach a value of $114.672


  • What you need to know about Near Protocol

    What you need to know about Near Protocol

    Near Protocol is a decentralized application (dApp) framework that allows developers to create apps that can be used on the internet.The Protocol is based on the Nightshade Proof of Stake consensus. Its goal is to achieve scalability and a consistent fee. In the year 2020, Near launched its mainnet.

    Near Protocol Apps

    There are numerous applications and tools for the Near Protocol. These are some of them:

    Near Wallet, SDKs for data structures used by developers, and testing tools for Assembly and Rust. Developers may use NEAR Explorer to easily debug and monitor network performance. To allow developers to use a local environment for testing applications, they can use the command line.

    Near is the Protocol’s native token. It has a variety of applications, including Transaction Fees and Validator Nodes. It is also utilized for Near Protocol governance votes. The coin can be purchased on a variety of exchanges, including Binance and Huobi.

    Price Movement – NEAR Protocol

    Before the crash in July, the coin was being traded at the price of $7.580. It later fell down to the price of $1.546. It quickly moved upwards and created a new ATH around the price of $13.230 in October. At the time of writing this article, Near Protocol is being traded at a price of $9.77. The price has almost decreased by 9% today. On the monthly time frame, we have seen an increase of almost 12%. It is still very far away from its ATH.

    About 90% of the newly issued tokens go to validators as rewards and the remaining goes to the treasury. 30% of transaction fees are rebates for smart contracts and the remaining 70% are burned.

    The Total volume at the moment is $317,339,460 with a decrease of 52.93% in the past 24 hours. The coin is listed on coinmarketcap on the 29th spot and has a market dominance of about 0.25%.

    Long Term Price Prediction 

    Wallet Investor thinks that it is a highly bullish coin and it would continue to rise in value. According to their prediction, in one year it will reach a value of $17.450. In a five-year plan, the price is expected to reach a value of $46.772. Traders think that it would soon reach the expected values in much less time.


  • What is ZCash (ZEC) and How does it Operate

    What is ZCash (ZEC) and How does it Operate

    The concept that everything is anonymous and transactions cannot be identified and linked to their users is a widely held belief among the general public, particularly among those who are new to the sector and industry of cryptocurrencies. Many people have bought into this idea and believe it till they become a part of the community. Every user has an address, which is used to transfer and receive cryptocurrency, or to conduct transactions. Each user has their own set of addresses. Different websites, like bscscan and etherscan, that list transaction and wallet details, make transaction details available to the public. These addresses can then be tracked using a variety of methods. But what if you don’t want anyone to be aware of your transactions or address details? This would necessitate the use of a blockchain that does not make these details public. One of these blockchain networks is Zcash (ZEC).

    What is Zcash and how does it work?

    Zcash is a blockchain that uses both zero-knowledge proof (a protocol in which a statement (transaction) is true without providing any proof other than the statement itself) and zk-SNARK (a protocol in which a statement (transaction) is true without providing any proof other than the statement itself) and zk-SNARK (a protocol in which a statement (transaction) is true without providing any proof other than (Zero-Knowledge Succinct Non-Interactive Argument of Knowledge). Whereas other blockchains make transaction details and addresses linked to separate wallets available to the public, Zcash (ZEC) does not do so by default. This information is shared, however, for regulatory compliance and auditing purposes.

    Transparent and Shielded transactions are the method Zcash can be used. In transparent transactions, people can observe the public addresses. On the other hand shielded transactions allow the use of zero-knowledge proof and zk-SNARK to completely hide the details of the transactions.

    Price Movement – ZCash (ZEC)

    At the time of writing, ZEC is being traded at the price of $167.18 with an increase of almost 2.5% in the last 24 hours. ZEC is a really strong token fundamentally. The maximum and minimum today are $171.79 and $161.43 respectively. The daily trading volume has decreased by almost 10.30%. ZEC had created its ATH in May 2021 and reached a price of almost $372. Even after the reversal, ZEC still hasn’t been able to recover from the damage and is trading at the price it had around May.

    ZEC has a circulating supply of almost 13.2M coins and a maximum supply of almost 21M. It is listed on coinmarketcap at rank 61. It can be exchanged on Binance, FTX, Gatie.io.

    Price Prediction – ZCash (ZEC)

    According to wallet investor thinks that ZEC is a good investment. According to them, in one year, ZEC would be worth around $242.573. In a five-year time span, the price is expected to reach a value of $546.406.

  • The Streaming Service – Audius (AUDIO)

    The Streaming Service – Audius (AUDIO)

    There are numerous streaming services for videos, gaming, and other forms of entertainment. Slowly but steadily, these industries began to embrace Blockchain, and they have now become a vital part of the crypto community. Audius is an example of a project that is tackling the music streaming industry. It puts the flavor of blockchain throughout the entire system where Spotify and other streaming services reside. This is where AUDIO comes in.

    Audius is a project that allows users to distribute, monetize their content to everyone else. Since its inception, the project has evolved significantly and now has a large user base.

    According to the whitepaper of the project, Audius offers the following features:

    • Stablecoins, Audio tokens, and artist tokens power the entire AUDIUS ecosystem.
    • It has a decentralized storage mechanism for audio that can be shared and stored.
    • A voting system that allows users, admirers, and artists to participate in the governance system.

    People can also use the Audius API to build apps on top of it.

    HedgeHog 

    Hedgehog is an Eth-based wallet that was designed to be utilized in regions where there are few or no financial assets. It is not suggested for use in situations involving large sums of money. Gaming and streaming services are examples of this.

    Price Movement – Audius (AUDIO)

    At the time of writing AUDIO is being traded at the price of $1.63 with a decrease of almost 7.30% in the last 24 hours. AUDIO is a really strong token fundamentally. The maximum and minimum today are $1.79 and $1.57 respectively. The daily trading volume has decreased by almost 46.57%. AUDIO had created its ATH in March 2021 and reached a price of almost $4.990. Even after the reversal, AUDIO still hasn’t been able to recover from the damage and is trading at the price it had around August.

    AUDIO has a circulating supply of almost 411M coins and a maximum supply of almost 1.05B. It is listed on coinmarketcap at rank 100. It can be exchanged on Binance, FTX, Gatie.io.

    Price Prediction – Audius (AUDIO)

    According to wallet investor thinks that AUDIO is a good investment. According to them, in one year, AUDIO would be worth around $3.717. In a five-year time span, the price is expected to reach a value of $12.033.

  • What is Uma – How does it Work?

    What is Uma – How does it Work?

    On Ethereum, UMA creates open-source infrastructure for “priceless” financial contracts. To be more exact, it consists of two elements. The first is the invaluable financial contract templates that were utilized to construct synthetic coins. The decentralized oracle service, which is used to govern and enforce contracts on UMA, is the second.

    The priceless decentralized finance (DeFi) contracts are made up of APIs that provide pricing data on-chain on a regular basis in order to handle Defi contracts. These contracts, on the other hand, are vulnerable to bribery, manipulation, flash loan attacks, and ad-hoc market occurrences. In the event of a dispute, however, priceless financial contracts are contracts that just demand the writing of a price on-chain (which is designed to be rare). Contracts on UMA with priceless contracts reduce dependency on oracles, making them less subject to attacks.

    The optimistic oracle, as well as the data verification process, are the foundations of the oracle (DVM). The upbeat Oracle enables contacts to seek and get price information rapidly. It functions as a generic escalation game between contracts that want to make a price request and the DVM, UMA’s dispute resolution mechanism. Unless it is disputed, the price established by the optimistic oracle will not be conveyed to the DVM. The method enables contracts to obtain price information in a predetermined amount of time without the necessity for an asset’s price to be posted on-chain.

    Price Movement 

    Before the crash in July, the coin was being traded at the price of $43.998. It later fell down to the price of $7.457. At the time of writing this article, The Uma (UMA) is being traded at a price of $9.904. The price has almost decreased by 8% today. On the monthly time frame, we have seen a decrease of almost 15%. It is still very far away from its ATH.

    The Total volume at the moment is $31,151,244 with a decrease of 32.73% in the past 24 hours. The coin is listed on coinmarketcap on the 124th spot and has a market dominance of about 0.03%.

    Long Term Price Prediction – Uma (UMA)

    Wallet Investor thinks that UMA is a highly bullish coin and it would continue to rise in value. According to their prediction, in one year UMA will reach a value of $13.693. In a five-year plan, the price is expected to reach a value of $29.461. Traders think that it would soon reach the expected values in much less time.

  • FTX Token (FTT) – What is the Chart Showing Us?

    FTX Token (FTT) – What is the Chart Showing Us?

    At the time of writing, FTT is being traded at the rate of $39.47 with a decrease of almost 2.45% within the last 24 hours.

    The low within this tenure was around $38.23 and the high was approximately $40.89. The coin as being in the watchlist of many traders makes it rank all the way up to number 30th according to the latest data released by coin market cap.

    FTT made its all-time high in the month of September 2021 where it reached an enormous amount of $89.74. At the moment it has a daily volume of $154,512,677 with an increase of only 1.36% within the last 24 hours. The circulating supply of FTT is now around 139M and the maximum supply is 352M. FTT has a dominance of 0.11%.

    The top exchanges for trading FTT are currently FTX, Binance, ByBit.

    Technical Analysis – FTX Token

    Starting from the monthly, the price is showing some sort of double top pattern. Now seeing this pattern majority will try to short this pair, so institutions would try to manipulate and grab the liquidity which gives a bullish bias on the monthly time frame. Shifting down to the weekly time frame, it can be observed that price has broken structure to the downside which gives a new low. After a new low, we anticipate a new high as well. So just following the anticipation, a new high can be anticipated. Now besides this, a bullish breaker can be observed as well, from where the price can show a reversal, and that aligns with our anticipation. The weekly time frame also gives a bullish bias

    FTT -1D

    Moving to the daily time frame. the price was actually getting rejected from the support zone. This produced a lot of liquidity below that zone. Price did a fake-out and is tapping in the zone, so it’s very likely that price has grabbed liquidity. Now it has all the fuel which is needed, so a bullish move can be expected.

    Price Prediction – FTX Token (FTT)

    Even though FTT has been one of the fast gainers and has been able to break out successfully. In the long run, traders are highly bullish on the project. The price is currently at the same level where it was in July and has completely retraced back. But according to the wallet investor, FTT isn’t a good investment. The price of FTT is to reach a value of $121.722 in a year.

  • QTUM –  What is the Chart Showing Us?

    QTUM –  What is the Chart Showing Us?

    At the time of writing QTUM is being traded at the price of $9.93. The price of the coin has decreased by almost 7.73% in the past 24 hours. The maximum and minimum of the day are around $10.83 and $9.57. The daily trading volume has on the other hand has increased by almost 18.11% in one day. QTUM is listed on coinmarketcap at 90th spot according to market capital and has a market dominance of about 0.04%.

    QTUM before the crash had achieved its all-time high around the price of $65.6 in May 2021. During the crash, it created a bottom and dropped down to $4.439. Just like many other coins, the coin showed reversal but it wasn’t strong enough and now is nearly at the bottom again and has nearly retraced back to the position which it had during the month of August.

    It has a total supply of around 103M tokens and has nearly all of them in circulation i.ie around 98.9M. It can be traded at a lot of different exchanges such as Binance, OKEx, Mandala Exchange, and Huobi Global.

    Technical Analysis – Qtum

    On the daily time frame, we can see that the price had shown beautiful movement upwards. A few weeks back, we can see that the price showed impulsive movement upwards. This move resulted in the price of QTUM shifting the structure and breaking the previous structure. At that point, an order block was created.

    Eventually, the price of QTUM failed to create another higher high and started to fall down. Soon that the price showed an explosive move downwards leaving behind an imbalance. The price fell down to such a level that the Order block was mitigated.

    QTUM -1D

    Now the price can show an explosive move soon. We can expect the price to drop down and mitigate the border block again. However, we should be looking for lower-time confirmations to take a possible entry in the coin. If the level of order block fails then we can go quite lower in the price. If it holds, we can soon expect a big move upwards.

    Price Prediction

    QTUM has been one of the highly bullish coins in the market. According to wallet investor, QTUM in one year is expected to reach a value of $21.211. In five years, it is expected to touch $65.955\. This shows that QTUM has a huge amount of potential in it and would give an amazing return to the people who would hold it.

  • Chainlink (LINK) – The Price drops almost 10%.

    Chainlink (LINK) – The Price drops almost 10%.

    At the time of writing this article, LINK has a value of $19.44 (3.11% decrease today) with a trading volume of $1,184,377,497 with a decrease of about 15.08% over the past 24 hours. Among the coins that have lost a lot. Link is one of the top losers.

    LINK is listed on coinmarketcap in 22nd place. It has a market dominance of about 0.41%. LINK had created its all-time high around the price of $53 in May 2021 and later fell down to the price of $13.38 in July.  This month has been bearish for the price and we have seen a decrease of about 21.53% in December. November was also bearish for the price and we saw a drop of about 15% in the price.

    The maximum supply of LINK is around 1B while the current circulating supply is around 467M coins.

    Technical Analysis – Chainlink (LINK)

    It can be seen that on the daily time frame, LINK had shown a reversal in the structure a few weeks ago. This happened when the price failed to create another high and faced massive rejection at the top. This can be seen in the chary clearly.

    The price had also left an imbalance while falling down. As a result of this move downwards, LINK had created a daily order block, that hasn’t been mitigated right now. Now the price is now falling down. We can see that the price has had a massive buying at the bottom and a big wick has been created. This left an imbalance on the downside as well.

    LINK - 1D

    Now the possible points to notice are the presence of imbalance below and the order block that is present above with the equilibrium for the consolidation present there two. The price can show two movements at that point. The first is that the price of LINK would reverse from the equilibrium position and drop down to touch the imbalance zone around the wick. The price can also do a possible fake-out, but the chances are that if it gets there, it will drop down.

    The second possibility is that the price could move towards the daily order block. From this point, two different scenarios should be taken into consideration. To look for a possible good entry setup, lower time confirmations should be taken into consideration.

    Price Prediction – Chainlink

    According to wallet investor, LINK is one of the most successful investments in the market. According to their predictions, LINK is expected to reach a value of $34.914 in a time span of one year. For a five-year plan, the price is expected to reach a value of $99.066.

  • NEO – Where will it move Now?

    NEO – Where will it move Now?

    According to coinmarketcap, the total supply of NEO is around 100M NEO and around 70M of the NEO are in circulation at the moment. It holds the 66th rank according to market cap and has a market dominance of about 0.09%.

    At the time of writing, NEO is being traded at the price of $27.94 with a decrease of almost 6.65% in the last 24 hours. The maximum and minimum today are $30.02 and $27.34 respectively. The daily trading volume has also decreased by almost 2.28%. NEO had created its ATH in January 2018 and reached a price of almost $198.20. The price later dropped down to a price of almost $3.89 during the month of March in 2020. Since then the price has shown reversal and has been on the same trajectory since then. The price did show strength in the beginning and touched $141 in May 2021 but once again, the price is nearly at the bottom. We have seen a decrease of almost 25.47% this month.

    Technical Analysis

    It can be seen on the daily time frame that at one time, NEO was printing higher highs. A point came when even though, the price broke the structure upwards, but it dropped down once again, signaling a fake-out. The price was still bullish as long as it didn’t break the structure downwards but it eventually went down, signaling a shift in structure.

    Now the price dropped down really hard from the BOS point, this resulted in the creation of an order block. This zone is unmitigated right now. The coin at the time is falling down.

    NEO -1D

    A few days back, the price dropped down really hard and an unmitigated zone has been created. This can drive the price downwards to that level. From there we can look for a reversal and back to the order block above. At that point, we would have to look for the lower time frame for confirmations to look for a possible long or a short.

    Price Prediction – Neo

    According to the traders, NEO is a good investment and is providing a great return. Wallet investor considers NEO to be a really good investment as well. According to them, in a year the price is expected to reach a value of $58.649. In five years the price is expected to reach a value of $182.703.

  • REVAIN (RVN) –  What is the Chart Showing Us?

    REVAIN (RVN) –  What is the Chart Showing Us?

    At the time of writing RVN is being traded at the price of $0.01014. The price of RVN has increased by almost 2.63% in the past 24 hours. The maximum and minimum of the day are around $0.01031 and $0.009738. The daily trading volume has also decreased by almost 16.56% in one day. RVN is listed on coinmarketcap at the 100th spot according to market capital and has a market dominance of about 0.04%.

    RVN before the crash had achieved its all-time high around the price of $0.29293 in February 2021. During the crash, RVN created a bottom and dropped down to $0.04050. Just like many other coins, the coin showed reversal but it wasn’t strong enough and now is nearly at the bottom again and has nearly retraced back to the position which it had during the month of August.

    RVN has a total supply of around 85B tokens and has the same amount of coins in circulation i.e. 85B. RVN can be traded at a lot of different exchanges such as KuCoin, HitBTC, Coinsbit, and BitMart.

    Technical Analysis – REVAIN

    The chart for RVH is one of the cleanest charts. The price a few weeks ago was following a trend line. It was providing its support and it had bounced there a lot of times. Ultimately the price broke down and reversed the structure. Now the price had been printing red candles.

    RVN - 1D

    A point to notice is the order block that is present below. The price was slowly dropping and soon printed a big wick which mitigated the order block. Now on the lower time frame, the price is consolidating. We can expect the price to wick down and mitigate the 50% of the wick down. From there we can expect the price to show a parabolic move upwards.

    Of course, the price can show a reversal from this point as well, without mitigating the lower value as well. So LTF confluence should be taken into consideration.

    Price Prediction – REVAIN (RVN)

    RVN(RVN) has been one of the highly bullish coins in the market. According to wallet investor, RVN in one year is expected to reach a value of $0.164. In five years, it is expected to touch $0.464. This shows that RVN has a huge amount of potential in it and would give an amazing return to the people who would hold it.