Tag: Crypto

  • IoTeX (IOTX) – The Price increased almost 15%.

    IoTeX (IOTX) – The Price increased almost 15%.

    At the time of writing this article, IOTX has a value of $0.1239 (13.58% Increase today) with a trading volume of $102,330,486 with an increase of about 111.20% over the past 24 hours. It has been of the top gainers today among the top 100 cryptocurrencies.

    IOTX is listed on coinmarketcap in 85th place. It has a market dominance of about 0.05%. IOTX had created its all-time high around the price of $0.2630 in November 2021.  This month has been bearish for the price and we have seen a decrease of about 19.54% in December. In November we saw an increase of about 113.50%.

    The maximum supply of IOTX is around 10B while the current circulating supply is around 9.54M coins.

    Technical Analysis – IoTeX

    On the daily time frame, we can see that IOTX has been always printing momentous green candles to break the structures. There are two possible points of interest here. First is the presence of the two order blocks that are present below. One of these order blocks is unmitigated at the moment. Both of these were created by the candles that broke the previous structural higher highs.

    The second point of interest is the candles a few days back which brought the price down to the first order block. These candles are highly inefficient in nature. Now the price has shown reversal from the first order block.

    IOTX - 1D

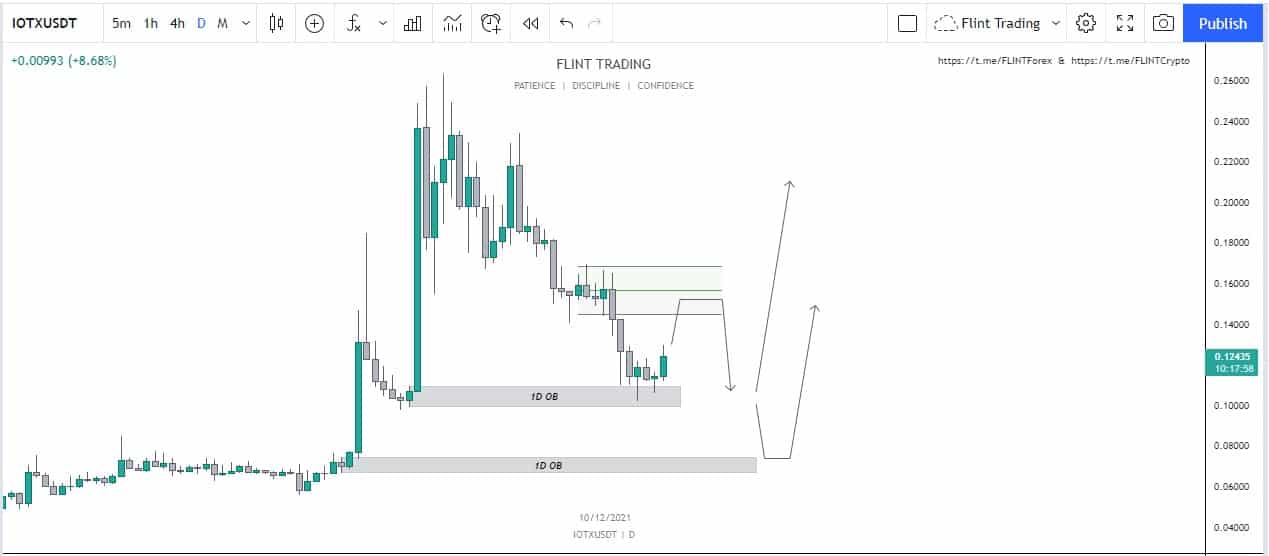
    Now the presence of imbalance can drive the price upwards. IOTX can mitigate the middle equilibrium position of the candles. From there we can expect a reaction from the price. If IOTX becomes stable above we look for a higher high otherwise it would drop the price to the lower order block.

    Now from there, the price can show two possible movements. Either it can go parabolic from there or it can drop down to the lower order block from where it can show a reversal. At that point, it is better to wait for the price to show a clear direction and then take your trade based on that trend with additional confluences.

    Price Prediction – IoTeX (IOTX)

    According to wallet investor, IOTX is one of the most successful investments in the market. According to their predictions, IOTX is expected to reach a value of $0.2085 in a time span of one year. For a five-year plan, the price is expected to reach a value of $0.6077.

  • Bitcoin SV (BSV) – What is the Chart Showing Us?

    Bitcoin SV (BSV) – What is the Chart Showing Us?

    At the time of writing BSV is being traded at the rate of $139.95 with a decrease of almost 4.91% within the last 24 hours.

    The low within this tenure was around $139.22 and the high was approximately $155.88. The coin as being in the watchlist of many traders makes it rank all the way up to number 56th according to the latest data released by coin market cap.

    BSV made its all-time high in the month of April 2021 where it reached an enormous amount of $494.267. In November BSV fell down to a price of $12.910. At the moment it has a daily volume of $326,568,508 with a decrease of 58.71% within the last 24 hours. The circulating supply of BSV is now around 18.98M and the maximum supply is 31M. BSV has a dominance of 0.11%.

    The top exchanges for trading BSV are currently OKEx, KuCoin.

    Technical Analysis – Bitcoin SV

    Even on the monthly time frame, we can see that the price had been slow to gain anything. There are wicks that called for a higher high. But the major portion of the price is at consolidation.

    The price had been respecting the trend line for quite some time and has bounced back from this support many times. Now for the past three to four months, BSV was consolidating on the monthly time frame still above the trend line. This month, the price dropped down and mitigated the very bottom of the level.

    BSV -1M

    We can see that there was an unmitigated order block present at the bottom. This move mitigated it.

    Now the only reason for the price to go down is the imbalance present in the candle. BSV can mitigate this wick at the equilibrium from where we can expect a possible long position. Of course here, we are looking at the monthly time frame. So LTFs should be looked at to have a cleaner entry.

    Price Prediction – Bitcoin SV (BSV)

    Even though BSV has been one of the slow gainers and hasn’t been able to break out successfully. In the long run, traders are highly bullish on the project. The price is currently at the same level where it was in July and has completely retraced back. But according to the wallet investor, BSV isn’t a good investment. The price of BSV is to reach a value of $121.722 in a year.

  • Everything you need to know about Decred (DCR)

    Everything you need to know about Decred (DCR)

    Decred is based on a Bitcointalk forum proposal for the Memcoin2 cryptocurrency from April 2013. Tacotime, a Bitcointalk user, proposed the new cryptocurrency and collaborated with _ingsoc, another Bitcointalk user, and Jake Yocom-Piatt to implement the hybrid (combining elements of public blockchains characterized by decentralized data and control and distributed governance and private blockchains primarily characterized by low latency and high scalability) Proof-of-Work (“PoW”) / Proof-of-Stake (“PoS”) consensus system from Memcoin2 to create a new project known as DCR.

    Essentials of Decred

    PoS was a significant development in the blockchain world, allowing users to stake their coins and so have a vote in the blockchain’s governance system. People are chosen to participate, and as a result, they are granted the authority to reach an agreement on governance.

    When explaining Decred, there are three key stages to consider:

    • The first is security, as the Proof-of-Work (PoW) – Proof-of-Stake (PoS) consensus method makes it much more difficult to hack than other PoW or PoS consensus chains.
    • The second feature is flexibility, which allows proposals to be promptly and fairly examined and adopted.
    • The Decred ecosystem’s resilience is the third factor to consider. It is centered on long-term objectives and long-term growth. The initiative has argued for decentralization from the start. Decred’s self-funding method, which was created to overcome the problems associated with traditional crypto project fundraising, exemplifies this.

    Price Movement – Decred

    At the time of writing DCR is being traded at the price of $88.06 with a decrease of almost 3.39% in the last 24 hours. DCR is a really strong token fundamentally. The maximum and minimum today are $100.08 and $87.11 respectively. The daily trading volume has increased by almost 179.04%. DCR had created its ATH in April 2021 and reached a price of almost $250. Even after the reversal, DCR still hasn’t been able to recover from the damage and is trading even lower than the bottom of June 2021.

    Price Prediction – Decred (DCR)

    According to wallet investor thinks that DCR is a good investment. According to them, in one year, DCR would be worth around $196.995. In a five-year time span, the price is expected to reach a value of $610.347.

  • Theta (THETA) – Where will it move Now?

    Theta (THETA) – Where will it move Now?

    According to coinmarketcap, the total supply of THETA is around 1B THETA and all of the THETA are in circulation at the moment. It holds the 40th rank according to market cap and has a market dominance of about 0.20%.

    At the time of writing, THETA is being traded at the price of $4.74 with an increase of almost 4.97% in the last 24 hours. The maximum and minimum today are $5.07 and $4.50 respectively. The daily trading volume has also increased by almost 8.47%. THETA had created its ATH in April 2021 and reached a price of almost $15.880. The price later dropped down to a price of almost $3.495 during the month of July. Since then the price has shown reversal and has been on the same trajectory since then. The price did show strength in the beginning but once again, the price is nearly at the bottom. We have seen a decrease of almost 28.35% this month.

    Technical Analysis – Theta

    On the daily time frame, we can see that the coin was creating lower lows and lower highs after getting rejected from the top. Since the crash of July, the price wasn’t able to recover and fell down to a minimum.

    The price showed some reversal but it wasn’t very strong and quickly dropped down to an even lower level. After that, the price carried upwards for a few backs before retracing down to the same level. This created equal lows with liquidity below.

    Theta -1W

    Now the price of Theta has two reasons to drop below. One is the presence of equal lows and the second is the order block that is present below. Chances are that the price would drop down to mitigate the order block or may as well show a reversal after grabbing the liquidity.

    Lower time frame confirmations should be taken into consideration while making an entry to have a more accurate entry in the price. If the price drops down further you can DCA and ultimately the chances are that the price would bounce back from the order block

    Price Prediction

    According to the traders, THETA is a good investment and is providing a great return. Wallet investor considers THETA to be a really good investment as well. According to them, in a year the price is expected to reach a value of $10.809. In five years the price is expected to reach a value of $35.371.

  • What is Compound (COMP) – A Lending Platform

    What is Compound (COMP) – A Lending Platform

    People deposit fiat cash into their bank accounts and earn interest on their deposits under the traditional banking system. These rates vary depending on the amount you’ve locked in and the bank you’ve chosen. A similar scenario currently exists in the blockchain world. Several projects have sprung up to allow for the borrowing and lending of cryptocurrencies at a fixed interest rate that varies with every project. Compound (COMP) is one such effort that allows users to borrow and lend cryptocurrency.

    What is Compound?

    Compound (COMP) is a decentralized application (dApp) that runs on the Ethereum network. It’s a lending platform that allows users to deposit cryptocurrencies into specialized pools and earn interest on them. The assets are locked, and interest (compound interest) begins to accrue based on the amount locked. This enables consumers to make gains of a size that is respectable. As previously said, the procedure is fairly similar to traditional banking, but it is decentralized and peer to peer, eliminating the need for centralized authority.

    On Compound (COMP), borrowers borrow from the pool, which is where lenders deposit their assets. Borrowers must eventually repay their loans, including interest, which is then dispersed among those who provided the liquidity in the first place. Lenders receive cTokens in proportion to the amount they have placed. They operate as a contract and may be used to redeem the funds they originally gave. As the exchange prices of these cTokens rise, consumers will be able to withdraw more money than they originally supplied. This is due to the interest they have earned as a reward. Because they all supply this project, platforms like AAVE, MAKER, and DEX are in direct rivalry.

    Price Movement – Compound 

    At the time of writing, COMP is being traded at the price of $215.41 with a decrease of almost 6.39% in the last 24 hours. COMP is a really strong token fundamentally. The maximum and minimum today are $230.43 and $213 respectively. The daily trading volume has also decreased by almost 15.21%. COMP had created its ATH in May 2021 and reached a price of almost $911. Even after the reversal, COMP still hasn’t been able to recover from the damage and is trading even lower than the bottom of June 2021.

    Price Prediction – Compound (COMP)

    According to wallet investor thinks that COMP is a good investment. According to them, in one year, COMP would be worth around $228.522. In a five-year time span, the price is expected to reach a value of $317.060.

  • The 3rd Generation – Hedera Hashgraph (HBAR)

    The 3rd Generation – Hedera Hashgraph (HBAR)

    Hedera Hashgraph is abbreviated as HBAR. HBAR is Hedera’s native energy-efficient coin that supports the decentralized economy. The platform enables the creation of safe, efficient, and powerful dApps. HBAR’s success is due to the fact that it is backed by some of the world’s most prestigious corporations. LG, Google, Standard Bank, Boeing, TATA, and IBM are all major players in the Hedera System’s governance.

    It was founded in 2018 through an initial coin offering (ICO) and debuted its mainnet in 2019. HBAR serves two purposes: it provides security to the entire HEDERA network via staking and it also powers other HEDERA services such as file storage, contracts, and transactions.

    Comparison Between BTC, ETH, HBAR

    • BTC transactions: 3+, Eth transactions: 12+, HBAR transactions: 10,000+
    • Average Fees: $22.57 for Bitcoin, $19.55 for Ethereum, and $0.0001 for HBAR
    • Confirmation of transactions: 10-60 minutes for Bitcoin, 10-20 seconds for Ethereum, and 3-5 seconds for HBAR (with finality).
    • Transaction Energy: 885+kwh for Btc, 102+kwh for Eth, and 0.00017kwh for HBAR.

    HEDERA’s Features

    • On-system minting of fungible and non-fungible tokens (NFT).
    • Security consensus for the entire Hedera system.
    • Smart Contracts, which allow developers to create a variety of dApps for the general audience.
    • A decentralized file storage system based on proof-of-deletion.

    Price Movement – Hedera

    Before the crash in July, the coin had created its All-Time High in March 2021 and reached a price of almost $0.455 before falling down to a price of $0.1382 in June 2021. It soon recovered and created a new ATH in September and reached $0.5760. At the time of writing this article Hedera (HBAR) is being traded at a price of $0.2639. The price has almost decreased by 8% today. On the monthly time frame, we have seen a decrease of almost 25%.

    The Total volume at the moment is $88,010,539 with an increase of 18.70% in the past 24 hours. The coin is listed on coinmarketcap on the 37th spot and has a market dominance of about 0.21%.

    Long Term Price Prediction – Hedera (HBAR)

    Digital Coin Price thinks that HBAR is a highly bullish coin and it would continue to rise in value. According to their prediction, in one year it will reach a value of $0.47. In a five-year plan, the price is expected to reach a value of $1. Traders think that it would soon reach the expected values in much less time.

  • VeChain (VET) – What is the Chart Showing Us?

    VeChain (VET) – What is the Chart Showing Us?

    At the time of writing, VET is being traded at the rate of $0.08938 with a decrease of almost 8% within the last 24 hours.

    The low within this tenure was around $0.08843 and the high was approximately $0.09809. The coin as being in the watchlist of many traders makes it rank all the way up to number 30th according to the latest data released by coin market cap.

    VET made its all-time high in the month of April 2021 where it reached an enormous amount of $0.27983. It later fell down to a price of $0.052 during the crash from where it showed reversal. At the moment it has a daily volume of $459,713,119 with a decrease of 7.95% within the last 24 hours. The circulating supply of VET is now around 64.32B and the maximum supply is 86.7B. VET has a dominance of 0.25%.

    The top exchanges for trading VET are currently Kucoin, Uniswap.

    Technical Analysis – VeChain (VET)

    VeChain on the daily time frame has been printing green candles for quite some time. The price had been bearish since a few backs and hasn’t been able to reverse.

    It can be seen that quite some time ago, VeChain created an order block while moving upwards and breaking the structure. This order block remained unmitigated for quite some time. Soon the price dropped down and mitigated the order block four days ago. The wick dropped down further and grabbed the liquidity.

    VET -1D

    Now the support has been held for now and we can expect a move from VET soon. The price can drop down and test the support area again. This is where an entry can be taken on the spot or a long position. If the supports break we can expect the price to drop down even further down. Taking additional confirmations into account, the possibility is that the price would soon move upwards and touch the imbalance present above.

    Price Prediction – VeChain

    Even though VET has been one of the slow gainers and hasn’t been able to break out successfully. But in the long run, traders are highly bullish on the project. The price is currently at the same level where it was in July and has completely retraced back.  According to the wallet investor, the price of VET is to reach a value of $0.193 in a year. IN five years, it would reach around $0.620.

  • AAVE –  What is the Chart Showing Us?

    AAVE –  What is the Chart Showing Us?

    At the time of writing AAVE is being traded at the price of $181.87. The price of AAVE has decreased by almost 5.54% in the past 24 hours. The maximum and minimum of the day are around $197.22 and $179.96. The daily trading volume has also decreased by almost 24.44% in one day. AAVE is listed on coinmarketcap at 59th spot according to market capital and has a market dominance of about 0.11%.

    AAVE before the crash had achieved its all-time high around the price of $668 in March 2021. During the crash, it created a bottom and dropped down to $170.1. Just like many other coins, the coin showed reversal but it wasn’t strong enough and now is at the bottom once again. In fact, it had a wick down to $159.2

    AAVE has a total supply of around 16M tokens and has the same amount of coins in circulation i.e. 13.4M. It can be traded at a lot of different exchanges such as Binance, Mandela, Upbit, Huobi with different trading pairs.

    Technical Analysis – AAVE

    AAVE on the daily time frame has been bearish on weekly time frame. During the crash, the price created a bottom, from where it had shown reversal. The price after that started to create a higher point but it failed and started to drop again.

    Now when the price showed reversal, it created a weekly order block, which hasn’t been mitigated. Now on the other hand, at the bottom, there is another order block that hasn’t been mitigated as well.

    AAVE- 1W

    We can expect the price to touch the order block at the bottom because it has lost a very important level when it dropped down the weekly level. From there we can look for a possible long with a target at the weekly order block above. From there, we can look for a possible entry depending on the lower time frame confirmations. If the price stabilizes, we can look for a possibly a long, and if it drops, it can be short.

    Price Prediction

    AAVE(AAVE) has been one of the highly bullish coins in the market. According to wallet investor, AAVE in one year is expected to reach a value of $265.731. In five years, it is expected to touch $580.585. This is almost four to five times the current price.

  • MINA – Where will it move Now?

    MINA – Where will it move Now?

    According to coinmarketcap, the total supply of MINA is around 824M coins and around 315M coins are in circulation at the moment. It holds the 86th rank according to market cap and has a market dominance of about 0.05%.

    At the time of writing the coin is being traded at the price of $3.71 with a decrease of almost 9.70% in the last 24 hours. The maximum and minimum today are $4.15 and $3.70 respectively. The daily trading volume has also decreased by almost 33.72%. MINA had created its ATH in November 2021 and reached a price of almost $6.674. The price later dropped down to a price of almost $4.547 and the monthly candle closed there. Since then the price has shown reversal and has been on the same trajectory since then. This month alone, we have seen a decrease of about 17.64% in the price.

    Technical Analysis

    On the daily time frame, we can see that the price had a drop from where it started to range for some weeks. It can be seen that soon after, the price went up to mitigate the order block. In this move, it grabbed the liquidity above as well by creating a new all-time high. After touching it, the price dropped down hard and made lower lows.

    Now a point of interest is the daily order block that is lying below, MINA has mitigated this level a few days back and has bounced from there. We can expect the price to reach the middle of the triggering order block, from where we can expect a reaction. It would most probably drop the price down and would touch the order block again as a test.

    MINA -1D

    When the price would touch the lower order block, we can look for a possible entry. This can be a long or a short depending on additional confluences. This 1D order block is very important and MINA should hold this level if it doesn’t want to fall even more.

    Price Prediction – Mina

    According to the traders, MINA is a good investment and is providing a great return. They think that soon MINA would be valued much more. On the other hand wallet investor considers MINA to be a bad investment and according to them, MINA would reach a value of  $0.696 in a single year.

  • Pancake Swap (CAKE) – Where to Now?

    Pancake Swap (CAKE) – Where to Now?

    At the time of writing this article, CAKE has a value of $11.80 (5.05% decreased today) with a trading volume of $163,511,459 with an increase of about 25.26% over the past 24 hours. The drop of BTC by 4% has once again dropped the altcoins as well.

    CAKE is listed on coinmarketcap in 54th place. It has a market dominance of 0.13%. CAKE had created its all-time high around the price of $44.28 in April 2021 and we saw an increase of about 125% that month. Soon after the price dropped to a level of $9.45. This month has been bearish for the price and we have seen a decrease of about 16.20% in December.

    The maximum supply of CAKE is around 247M and has the same current circulating supply which is around 247M coins.

    Technical Analysis – Pancake Swap (CAKE)

    CAKE has been one of the slow gainers and one of those coins that are bearish on the higher time frame. We can see that the price was respecting a trend line and it had bounced from there during the crash. But it failed to shift the structure on the higher time frame.

    It created a lower high and eventually came down to touch the trend line once again. It can be seen that for the past month, the price was printing red candles. As a result, we can see that the price, failed to hold the trend line and has broken below.

    CAKE -1W

    Now during this move which brought the price down, a weekly order block was created. This order block at the moment is unmitigated and as a result, this can be a reason for the price to move up now. If this happens then possible short positions can be opened at the order block, if we get the lower time frame confirmations for the reversal. Invalidation would be price going above and stabilizing itself from where we can look for a long position.

    Price Prediction – Pancake Swap

    According to wallet investor, CAKE is one of the most successful investments in the market. According to their predictions, CAKE is expected to reach a value of $30.618 in a time span of one year. For a five year $109.548. Investors think that it will soon reach the expected price though and we wouldn’t have to wait so much for the price to show big prices.