Tag: Technical Analysis

  • ICP coin price prediction –A possible revival?

    ICP coin price prediction –A possible revival?

    ICP coin – also known as Internet Computer Protocol – is regarded to have disruptive technology. The network is aiming to disrupt the centralized cloud computing on which cryptocurrencies rely for their decentralization. If successful, ICP also possess the potential to be a revolutionizing technology in the crypto space.

    ICP has a blockbuster entrance in the crypto market with its price touching $1,000 if not more, on some exchanges. However, the cryptocurrency fell flat on its face from its journey towards the moon right after the launch hype died down. But is it making a comeback now?

    In the daily timeframe, ICP crypto has started off on a bullish uptrend. At the time of writing, ICP coin stands at a price level of $46.64. The price has increased by 5% in the past twenty-four hours while the weekly increase is 45% – making it one of the best performers of the week. The daily trading volume has observed a decline of 15% while the market rank continues at twentieth.

    Internet Computer Protocol – ICP price prediction

    The market outlook for the cryptocurrency has turned bullish. Out of the total twenty-six technical indicators, eleven are giving out a signal of buy with nine standing at a neutral position and only two indications of sell.

    Internet Computer Protocol
    Internet Computer Protocol

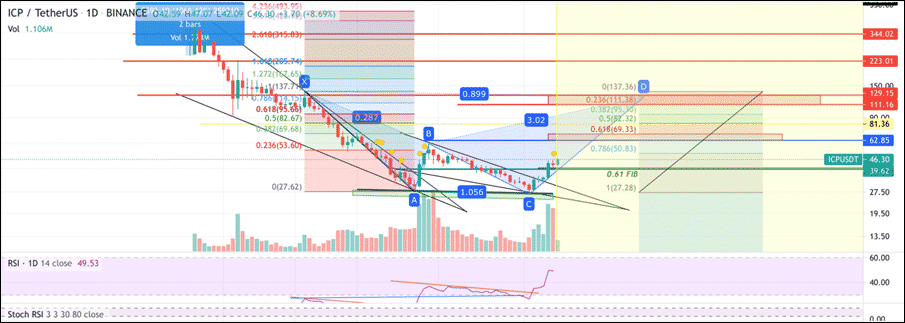
    A trader’s analysis identifies the formation of a bearish butterfly pattern by the price movements of ICP coin. Although the harmonic pattern is bearish in the long term, it suggests a price increase in the short to a medium-term timeframe. The price level of $50 lying at the 0.786 Fibonacci Retracement level is the next price target for ICP coin. Other major resistance levels/price targets lie at $81, $111, $129, $223 and finally $344. The 0.61 Fibonacci level at $39 has been registered as strong support.

    The estimates of Digital Coin Price also suggest a rise of ICP to $71.81 by the end of 2021 and a subsequent climb towards $203 by 2028. This shows the market sentiment for ICP still remains uncertain – where some projections show the cryptocurrency to be bullish in the short run, others regard it to be bullish in the long run.

  • Polygon (MATIC) Coin – Nearing a bullish breakout

    Polygon (MATIC) Coin – Nearing a bullish breakout

    Polygon (MATIC) is one of the best performing cryptocurrencies in the daily timeframe. Polygon has been on a downtrend with a weekly loss of 7% but the recent price movements show a possible reversal of the downtrend. At the time of press, MATIC stands at a price level of $0.83. The price has increased by 33% in the past twenty-four hours while the daily trading volume has shot up by 105%. Polygon is the nineteenth largest cryptocurrency in the market.

    Polygon (MATIC) Technical Analysis

    The bullish outlook of MATIC coin has yet to be seen in the technology of the cryptocurrency. Out of the twenty-six technical indicators, twelve are giving out an indication of sell with ten standing at a neutral position and only four indications giving out a bullish signal. The oscillators are neutral while the moving averages are still suggesting a downtrend; however, the technical indicators may be expected to change soon given the recent bullish momentum.

    Polygon (MATIC) Technical Analysis
    Polygon (MATIC) Technical Analysis

    Polygon crypto has been identified to be operating in a triangle formation by a trader’s analysis. Per the analysis, the cryptocurrency had been moving downwards; however, the recent bullish candle is indicative of the strengthening bulls in the market. Polygon crypto is also approaching the end of the triangular formation so a break out is likely. Given the current sentiment, an upside break out from the formation appears to be likely. Although nothing is certain in the crypto market.

    Polygon (MATIC) future outlook

    Polygon has gained significant popularity in a limited time. The scaling solution for Ethereum has been active in the field. The development team recently launched a new division that will be focusing solely on NFTs and blockchain games. With the new projects, Polygon aims to become the go-to platform for gaming and NFTs in the market. The new addition to the platform can significantly boost its performance in the upcoming days.

  • Uniswap coin price to succumb to the bears?

    Uniswap coin price to succumb to the bears?

    Uniswap coin has been trending downwards but as the cryptocurrency market regained some bullish momentum so did Uniswap. At the time of press, Uniswap coin stands at a price level of $15.62. The price has increased by 6% in the past twenty-four hours while the daily trading volume has also been increasing. Although in the weekly timeframe, Uniswap has declined by nearly 10%.

    Uniswap Coin Technical Analysis

    The market sentiment for the cryptocurrency continues to be bearish. Out of the total twenty-six technical indicators, fourteen are standing at a position of the sell while seven indicators are standing at a neutral position with five bullish indicators. The oscillators are bullish while the moving averages are bearish.

    Uniswap Coin Technical Analysis
    Uniswap Coin Technical Analysis

    Uniswap coin has been identified to be operating in a descending channel formation. The cryptocurrency has been oscillating up and down inside the formation. Per a trader’s analysis, the cryptocurrency is expected to test the lower boundary as support, and once established, an upside pullback can be expected from Uniswap coin. On the upward move, Uniswap can reach towards the upper boundary at $14.45. Although the price target is lower than the current price, it will provide a good return from the low.

    Uniswap Coin Future Prospects

    Uniswap is one of the most popular decentralized exchange or also known as an automated market marker. The exchange provides a better alternative to centralized exchanges for those who want greater control. The future potential of the cryptocurrency is huge. A testament to the protocol’s importance is Uniswap making up more than 50% of the market cap of Grayscale’s new DeFi fund.

    According to the estimates of Wallet Investor, Uniswap coin will be trading hands at $53 in a year’s time while the five-yea price is predicted to be at $200. Digital Coin Price is also bullish on the cryptocurrency, albeit not as much. Per their estimates, Uniswap coin will end the year with a price level of $23 and reach towards $71 by 2028.

  • XRP coin – Bullish momentum in sights & lawsuit update

    XRP coin – Bullish momentum in sights & lawsuit update

    XRP coin is at crossroads between bullish and bearish pressures. XRP coin has been falling in tandem with the crypto market; however, in the daily timeframe, minor bullish momentum can be seen. At the time of press, XRP coin stands at a price level of $0.54. The price has increased by 3% in the past twenty-four hours while the daily trading volume has dropped by nearly 9%. In the past seven days, XRP has declined by 9%.

    XRP Coin Technical Analysis

    The market sentiment for the cryptocurrency is bearish. Out of the total twenty-six technical indicators, fifteen are standing at a position of sell with nine indicators are standing at a neutral position and only three indications are at a bullish position of buy. The oscillators are neutral while the moving averages suggest a strong downtrend.

    XRP Coin Technical Analysis
    XRP Coin Technical Analysis

    A trader has identified a crucial support level for the cryptocurrency in his analysis. Per the trader, the support level at $0.51 will help XRP coin regain bullish momentum. The cryptocurrency can be observed to be on a pull back to the upside from the support level. If the bulls begin to gain footing in the market, the price target at $0.70 will be activated for XRP coin. If the price target is achieved the next target will lie at $0.82. The upcoming price action of the cryptocurrency will prove to be crucial for its future trajectory.

    XRP lawsuit update

    Ripple Labs has been tangled in a lawsuit with the SEC as the SEC accuses Ripple Labs of being involved in the illegal securities trade of XRP. Both parties have been going back and forth – delivering blows – but no decisive judgment seems to be insights. Ripple Labs did bag a small victory as the presiding judge granted the counsel its motion to dispose an SEC executive. The deposition, originally to be held on 19 July, was delayed by the court till 27 July so that both parties can reach an agreement regarding the scope of the deposition.

  • Monero coin – Bearish momentum to continue or end?

    Monero coin – Bearish momentum to continue or end?

    Monero coin has shown signs of the onset of bullish momentum in the daily timeframe. The cryptocurrency had been falling since the beginning of June; however, the bearish momentum may have come to a halt. In the past seven days, Monero coin declined only by 3%. At the time of press, Monero stands at a price level of $190. The price has increased by more than 3% in the past twenty-four hours and the daily trading volume has also been climbing upwards.

    Monero Coin Technical Analysis

    The recent bullish momentum has not yet been translated to the technicals for the cryptocurrency. The market sentiment continues to be bearish for Monero. Out of the total twenty-six technical indicators, fourteen are giving out an indication of sell with eight standing at a neutral position and only four indications of buy. The oscillators are bullish while the moving averages suggest a downtrend.

    Monero Coin Technical Analysis
    Monero Coin Technical Analysis

    Despite the minor bullish divergence in the market, the short-term future prospects for Monero coin are bearish. A trader’s analysis shows the completion of a head and shoulder formation by the cryptocurrency. The H&S formation is a bearish pattern and has been completed by Monero. The pattern has been validated as Monero crossed the neckline of the formation. Monero coin can be expected to test crucial support levels in the upcoming days. The first Fibonacci support level can be found at $184 followed by $137 and $118.

    Monero coin in the long run

    Monero is one of the most popular privacy coins – if not the most – in the market. Privacy coins offers the anonymity that giants like Bitcoin and Ethereum lack which makes them an attractive prospect. The long-term price projections for Monero are; hence, positive. Per the estimates of Wallet Investor, Monero coin will be operating at a price level of $335 in a year’s time while the five-year price will be at $879. Digital Coin Price predicts similar projections with the price hitting $395 in 2023 and crossing $821 by 2028.

    So, even if the bears continue to dominate the market in the short run, the cryptocurrency is expected to ultimately cross $800 in the long-term and reach even higher.

  • Ethereum Classic (ETC) Coin – Will it regain bullish momentum?

    Ethereum Classic (ETC) Coin – Will it regain bullish momentum?

    Ethereum Classic has been trending downwards in tandem with the general market; however, signs of bullish momentum can be observed in the recent timeframes. In the past week, Ethereum Classic declined by 4% but in the daily timeframe, the cryptocurrency is going upwards. At the time of press, Ethereum Classic stands at a price level of $41.56. The price of the cryptocurrency has increased by nearly 7% in the past twenty-four hours while the daily trading volume has declined by 22%.

    Ethereum Classic technical analysis

    The market sentiment for Ethereum Classic continues to be bearish despite the recent bullish divergence in the market. Out of the total twenty-six technical indicators, twelve are giving out an indication of sell with nine indicators standing at a neutral position and only five indicators bullish with a buy signal. The oscillators are mainly neutral while the moving averages suggest a strong sell.

    Ethereum Classic technical analysis
    Ethereum Classic technical analysis

    The bulls in the daily timeframe need to gear up in order to cause a trend reversal as Ethereum Classic is still going downwards. The cryptocurrency has been identified to be operating with a descending trendline. The trendline has also formed a triangular pattern with a horizontal support line at the price level of $37.44. Ethereum Classic can be observed to be approaching the end of the triangular pattern and; hence, a break out is likely. Although the direction of the break out is hard to determine at this stage, the odds may be favoring the downside given the strength of the bearish pressures.

    Will Ethereum Classic go up?

    Ethereum Classic has given a phenomenal performance in the bull run of 2021 and it did not end with the bull run. The cryptocurrency had been the star of the second quarter even though the market turned bearish and cryptocurrencies started falling. ETC coin had a staggering 297% gain Q2 of 2021. The hard fork of Ethereum is gaining increasing popularity and even though the short-term outlook is bearish, in the long-run ETC coin is expected to further increase in value.

  • UNUS SED LEO price prediction – LEO coin to break ATH?

    UNUS SED LEO price prediction – LEO coin to break ATH?

    UNUS SED LEO cryptocurrency has been on an uptrend since the end of June despite the bearish outlook of the market. The cryptocurrency has increased by 8% in the past seven days. At the time of writing, LEO coin stands at a price level of $3.13. The price has increased by 6% in the past twenty-four hours while the daily trading volume has declined by 35%. LEO coin is the twenty-eight largest cryptocurrency in the market.

    LEO coin technical analysis

    The market sentiment for the cryptocurrency is bullish given its uptrend. Out of the total twenty-six technical indicators, sixteen are giving out an indication of buy with five indicators standing at a neutral position and five at a sell position. The oscillators are bearish with a sell signal while the moving averages are suggesting a strong uptrend.

    LEO coin technical analysis
    LEO coin technical analysis

    LEO coin has observed phenomenal growth in the year 2021. The cryptocurrency started off the year with a price level of $1.3 and established its all-time high at $3.9 during the peak of the 2021 bull run. The market corrections after the bull run proved to be fatal for LEO coin as well; however, the cryptocurrency still did not reach its pre-bull run price levels. The current bullish trend of the market may be indicative of a strong bull wave. Per a trader’s analysis, the price level of $3.01 has been established as strong support by UNUS SED LEO. The immediate resistance level lies at the ATH price of $3.9. If the bullish momentum persists, LEO coin can reach towards breaking the ATH level.

    UNUS SED LEO price prediction

    The utility token used across the iFinex ecosystem is predicted to have a bright future. As the rate of return on the utility token depends on how much LEO is being held by the user, it incentivizes holding and; hence, causes a price increase. According to Wallet investor, LEO coin is estimated to have a price of $4.45 in a year’s time while the five-year projection lies at $10.40. Digital Coin Pricepredicts a similar future trajectory for the cryptocurrency with a price of $4.53 by the end of 2021 and $11.16 by 2026.

  • Klaytn price prediction – KLAY coin towards $1?

    Klaytn price prediction – KLAY coin towards $1?

    Klaytn coin, after a strong downtrend, appears to have lost the strength of the bears. KLAY coin appears to have entered a brief consolidation period marked by decreased price volatility but swinging price movements. At the time of writing, KLAY coin stands at a price level of $0.89. The price of the cryptocurrency has increased only slightly – by 2% – in the past twenty-four hours while the daily trading volume has gone up by 60%. In the weekly timeframe, Klaytn observed a slight decrease of 2%.

    Klaytn technical analysis

    The market outlook for the cryptocurrency is bearish despite the slowed volatility and upward movement. Out of the total thirteen technical indicators, eight are giving out an indication of sell with four indicators standing at a neutral position and only one indication bullish. The oscillators are neutral while the moving averages are bearish.

    Klaytn technical analysis
    Klaytn technical analysis

    Klaytn Coin has been operating in a descending channel formation since the beginning of July. However, the price has become relatively stable with decreased volatility. The price action of the cryptocurrency appears to be consolidating while having become relatively stable. Does this mean the onset of bullish momentum for KLAY coin? The upcoming decisive price action will prove to be crucial for the future trajectory of the coin. Various important levels of support and resistance have also been identified for KLAY coin. The immediate resistance lies at the price level of $0.92 – at the 0.786 Fibonacci Retracement level – while the support lies at $0.76.

    KLAY coin price prediction

    Klaytn blockchain focuses on improving the user experience of the blockchain technology in order to boost its adoption. The long-term price predictions for the cryptocurrency are bullish. According to Wallet Investor, Klaytn will be operating at a price level of $2.52 in a year’s time while the five-year forecast places the cryptocurrency at $8.80. Digital Coin Price predicts a price of $1.3 by the end of 2021 while the five-year projection is at $3.3.

  • Celo crypto price prediction – To cross $3 soon?

    Celo crypto price prediction – To cross $3 soon?

    Celo crypto’s bullish momentum died in late July. Ever since then, cryptocurrency has been moving downhill on a strong trend. At the time of writing, Celo coin stands at a price level of $2.25. The price of the cryptocurrency has increased by 5% in the past twenty-four hours while the daily trading volume has shot up by 130%. In the weekly timeframe, Celo crypto has declined by 16% – whether the current upside movement is a reversal of the downward trend will be made clear by upcoming price actions.

    Celo crypto technical analysis

    The market sentiment for Celo continues to be strongly bearish. Out of the total twenty-six technical indicators, fourteen are giving out an indication of sell with nine indicators standing at a neutral position and one indication at a bullish sell. Both the oscillators and moving averages are strongly bearish with moving averages more so than the oscillators.

    Celo crypto technical analysis
    Celo crypto technical analysis

    Celo crypto’s current price movement has been identified to be mirroring historical price actions. The cryptocurrency is on an upward move currently. If Celo follows the historical price movements of late June, the current bullish momentum can be expected to last only for a short while. After which strong bearish pressure will lead the cryptocurrency to test crucial support levels. It is after the lows that Celo will begin to regain bullish momentum and reach towards breaking the high of the previous top. However, the analysis needs to be validated first by the cryptocurrency.

    Celo crypto price prediction

    The blockchain targeting crypto adoption of smartphone users appears to have a bullish outlook in the long term. According to Wallet Investor, the cryptocurrency is expected to have a price of $4.38 in a year’s time while the five-year projection is at $12.31. Per the estimates of Digital Coin Price, Celo coin will end the year with a price of $3.28 and is expected to reach towards $9.95 by 2028.

  • Ethereum coin price prediction: Price target at $2,250

    Ethereum coin price prediction: Price target at $2,250

    Ethereum coin continues its downtrend although at a decreased rigor. At the time of writing, Ethereum coin stands at a price level of $1,818. The price has fallen by 5% in the past twenty-four hours while the trading volume has decreased by 10%. ETH coin continues to vie for bullish momentum but with strong bear dominance, a bullish divergence cannot be sustained by the cryptocurrency.

    Ethereum coin technical analysis

    The market sentiment for cryptocurrency continues to be bearish. Out of the total twenty-six technical indicators, sixteen are giving out an indication of sell with the remaining ten indicators standing at a neutral position and zero signals at bullish indication.

    Ethereum Coin Technical Analysis
    Ethereum Coin Technical Analysis

    Although the market outlook for Ethereum coin is bearish in the shorter timeframes, would the bearish divergence continue or can the bulls be expected to dominate the market? Per a trader’s analysis, ETH has been identified to be operating in a falling wedge formation. The falling wedge is a bullish pattern. Per the analysis, Ethereum coin has also formed a coherent wave count inside the falling wedge. A pullback from the lower boundary of the formation can be expected in the upcoming days. If the pullback is successful and the onset of bullish momentum begins, a break out from the formation will become likely. In that case, the potential price target set at $2,250 will be activated.

    What is going on in Ethereum coin’s space? 

    Ethereum – the second-largest cryptocurrency – is an integral part of the crypto space because of its offering of decentralized finance through smart contracts. The aim of the network is to become the global platform for decentralized apps. The decentralized finance lending network Aave has announced to “build Twitter on Ethereum”. The co-founder of Aave, StaniKulechov, has tweeted the platform will give greater control to the audience. The news is one example of what Ethereum is capable of while the crypto space and its uses are still being explored.