Tag: Technical Analysis

  • Cosmos (ATOM) – Time to Retrace a Bit?

    Cosmos (ATOM) – Time to Retrace a Bit?

    The native token of the Cosmos Ecosystem is ATOM.

    At the time of writing ATOM is being traded at the price of $29.95. The price of ATOM has decreased by almost 7.62% in the past 24 hours. The maximum and minimum of the day are around $32.82 and $29.32. The daily trading volume has also decreased by almost 33.59% in one day. ATOM is listed on coinmarketcap at 33rd spot according to market capital and has a market dominance of about 0.26%. It created its all-time high in the month of September 2021 and reached a value of $44.80.

    ATOM has a total supply of around 282M tokens and has a circulating supply of around 225M coins. ATOM can be traded at a lot of different exchanges such as Binance, OKEx, Huobi with different trading pairs.

    Technical Analysis- Cosmos (ATOM)

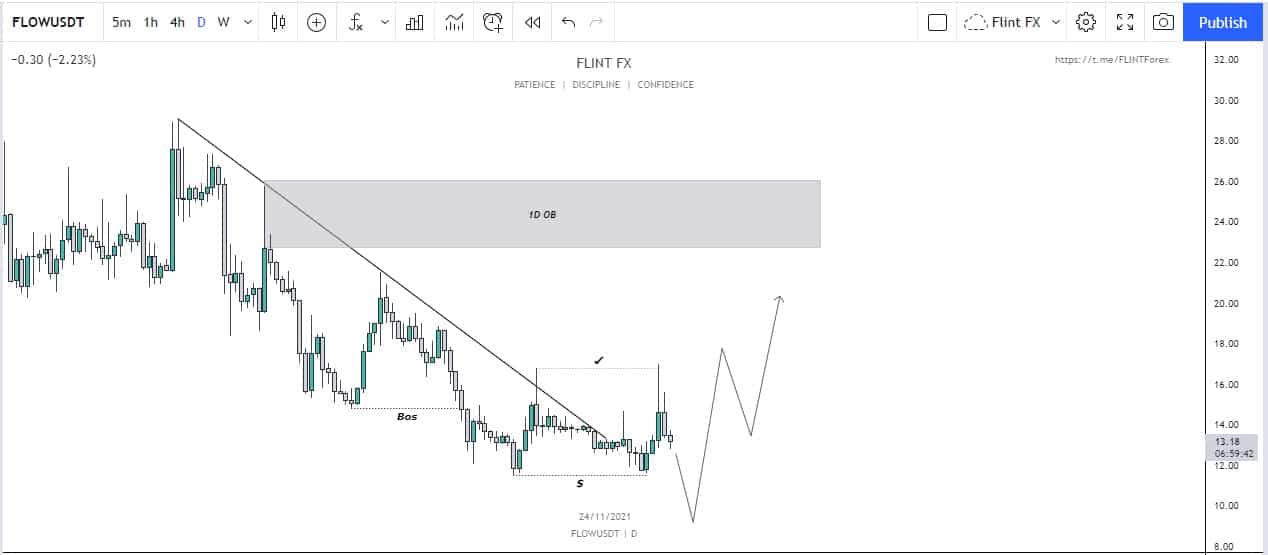
    On the daily time frame, we can see how the price of Atom was reacting before the break of structure. It was clearly facing resistance from the trend line. Soon it broke above but it wasn’t for long before the price broke structure again after facing strong resistance from a zone. It nearly touched its time high but the price quickly dropped down.

    Cosmos (ATOM) -1D

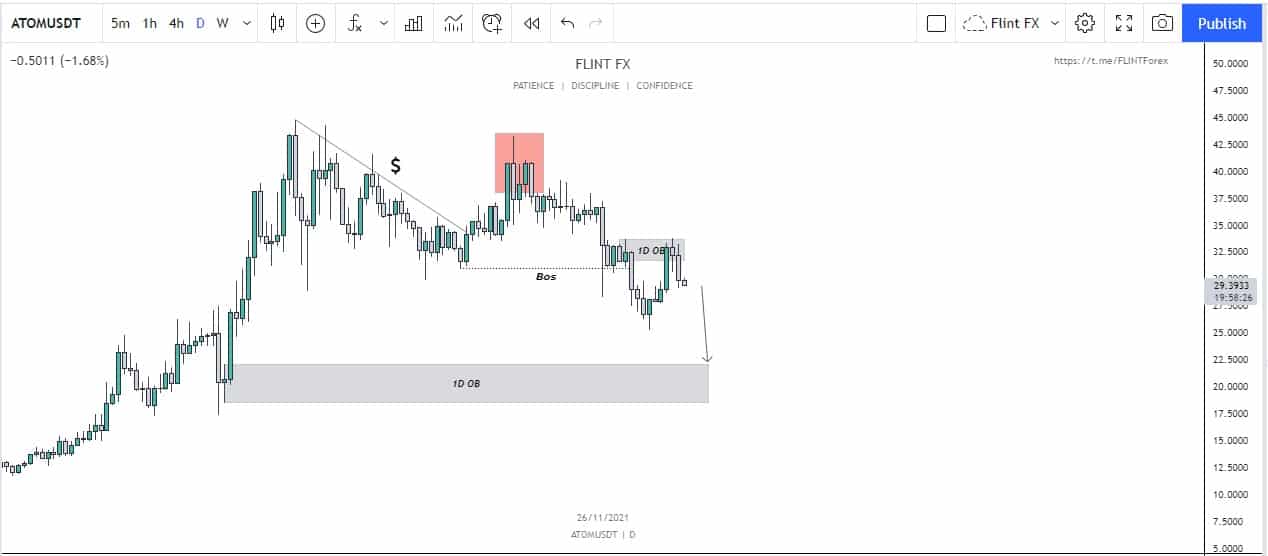
    During the break of structure, the price of ATOM created an order block which resulted in the drop of the price. The price mitigated the order block again and as a result of the reaction it faced, it quickly dropped down again. Now the only unmitigated order block lies below which can drop the price down. If a clear break above is not observed and the price doesn’t go above the order block we can expect it to drop to a level of $20. From there we can expect a possible long to the price of $28.

    But if the price regains the momentum and captures the level again, we can expect the price to go and try to touch the $40’s again.

    Price Prediction – Cosmos (ATOM)

    ATOM is one of the most successful ecosystems in the market. Its market cap is evidence of how successful the project is and as a result, it is considered a good investment. According to the wallet investor, ATOM is expected to reach a value of $0.185 in one year. In five years ATOM is expected to reach almost $0.448. But investors think that the price will go much higher than the one which is expected.

  • THORChain (RUNE) – What to Expect from the Chart

    THORChain (RUNE) – What to Expect from the Chart

    According to coinmarketcap, the maximum supply of RUNE is around 461M RUNE and the circulating supply is around 258M RUNE. RUNE holds the 61st rank according to market cap and has the market dominance of 0.11%.

    At the time of writing RUNE is being traded at the price of $11.27 with an increase of almost 8.01% in the last 24 hours. RUNE is bullish for the long term. The maximum and minimum today are $11.97 and $10.39 respectively. The daily trading volume has also increased by almost 111.65%. RUNE had created its ATH in May 2021 and reached a price of almost $21.280. During the crash, the price of RUNE dropped down to a level of $3.010. The price is trying to regain its momentum and cross the all-time high but it can drop for some time.

    Technical Analysis – THORChain (RUNE)

    Even though we can see that Rune is going to drop but it doesn’t mean that the higher time frames (monthly and weekly) are showing the same. The price is quite bullish and we can expect it to go higher in the long run but currently, the price may retrace back a little.

    The price broke structure and started moving upwards and this was done with strong momentum. This did create an order block but was invalidated when the price created the second order block after it started to drop. It created a head and shoulder pattern which resulted in the price dropping down (this created the new order block). Now the price has broken structure. We can expect that it will move upwards to the order block and if a clean break is observed from this level, we can expect the price to move up again.

    ThorRune (RUNE) - 1D

    If the price shows any kind of reaction, we can expect that it would result in a drop to the unmitigated order block which was created by the first impulsive move. The presence of the inefficient price movement is also a confluence for the price to a dropdown.

    Price Prediction – THORChain (RUNE)

    In the long run, RUNE is a good opportunity. According to the wallet investor, the price of Rune is to reach a value of $11.531 in a year. For a five-year plan, the price will reach a value of $59.536. But the investors are even more bullish on the value and they think that it will reach even more.

  • AMP Coin gains 20% – Where to Now?

    AMP Coin gains 20% – Where to Now?

    The coin had created its All-Time High in June 2021 and reached a price of almost $0.121 before falling down to a price of almost $0.0377 by losing more than 60% of its value. At the time of writing this article AMP is being traded at a price of $0.067. The price has almost increased by 20.82% today. In this month alone the price has increased by 37.09%.

    The Total volume at the moment is $159,022,651 with a decrease of $36.76 in the last 24 hours. The coin is listed on coinmarketcap on the 92nd spot and has a market dominance of about 0.05%.

    Technical Analysis

    Amp has been continuously printing higher highs. The price is respecting the trend line from where it has bounced from multiple occasions on the weekly time frame. Even on the monthly time frames, we can see very clearly how the price has respected the trend line and has continued to move upwards. We can see that the price wicked very high but it wasn’t able to sustain itself and fell down aggressively which created a higher low and didn’t break the structure of the price movement.

    Amp when dropped created a new order block. Seeing how the price this week has gained momentum, it can be said that it would tackle the order block again. A 50% mitigation of it can be expected by the price from where a possible reaction can be expected.

    Amp (AMP) - Weekly

    Overall the price is bullish on higher time frames. If the price reaches the order block then new confluences would show where the price can move then. If it holds then we can expect Amp to move higher. If it faces rejection we can expect the price to dropdown.

    Long Term Price Prediction – Amp

    Wallet Investor thinks that Amp is a highly bullish coin and it would continue to rise in value. According to their prediction, in one year Amp will reach a value of $0.1035. In a five-year plan, the price is expected to reach a value of $0.313.

  • Voyager (VGX) Coin Gained 28% this week – Where to Now?

    Voyager (VGX) Coin Gained 28% this week – Where to Now?

    According to coinmarketcap, the total supply of VGX is around 278M tokens and the circulating supply is around 278M VGX. VGX holds the 92nd rank according to market cap.

    At the time of writing VGX is being traded at the price of $4.95 with a decrease of almost 5.36% in the last 24 hours. VGX is a really strong token fundamentally. The maximum and minimum today are $5.76 and $4.68 respectively. The daily trading volume has decreased by almost 36.76%. VGX had created its all-time high and reached a price of almost $6 last week. But the price of VGX dropped to $3.62 in the same week but soon printed a green bullish candle.

    Technical Analysis – Voyager (VGX)

    The chart of Voyager (VGX) as seen on a 1-hour time frame shows a very beautiful movement. The price broke the structure and broke upwards and created an order block in the process. It can be seen that soon after that, the price came back to mitigate that level from where another attempt to create a higher high was created which failed. This brought the price of VGX and constricted it to a triangle.

    The point to notice is the clear fake-out, done by the price. The price eventually came back down after grabbing the liquidity. Keeping in mind this movement and how the price still has the momentum (it seems that the bulls are in control at the moment) so we can expect it to drop down to grab the liquidity and do a fake-out. A possible level to which it can drop is the clear level of order block from where it can bounce back.

    Voyager (VGX) - 1H

    If the price drops down, it can be a really good entry point depending upon lower time confirmations. We can expect the price to move up as soon we see bullish momentum from the price. If the price of VGX goes up again we can wait for a possible retest to take a position in the market.

    Long Term Investment – Voyager

    According to the wallet investor, it is a very good investment. In a one-year plan, VGX is expected to reach a price of  $6.653. In a five-year plan, it is expected to reach a value of $15.468 which is almost two times what it is being currently being traded at. It is one of the most popular coins in the cryptomarket.

  • Stacks (STX) Coin – What does the Chart Tells us Now?

    Stacks (STX) Coin – What does the Chart Tells us Now?

    At the time of writing STX is being traded at the price of $2.06. The price has decreased by almost 7.47% in the past 24 hours. STX created its all-time high around the value of  $2.850 in April 2021 before the drop to a value of $0.500. The daily trading volume has decreased by almost 24.06% in a day. The total supply of STX is around 1.352B tokens. The circulating supply is around 1.28B STX.

    The Native Token – Stacks  (STX)

    The native token of Stacks is known as STX. STX has a variety of use. It is used for the execution of smart contracts. It is used for transactions and also for registering new assets on Stacks. STX is listed on coinmarketcap at 65th position and has a market dominance of about $0.10.

    Technical Analysis- Stacks (STX)

    Stacks (STX) has been one of the coins that have been slow to gain pace but are slowly gaining more and more. The chart at the moment is showing bearish movement.

    The price moved up by creating an order block which eventually broke the structure towards the upside. It continued to create a higher high till a point came from where it wasn’t able to create a new high. That was a sign that the market structure is shifting bearish. From there lower highs and lower lows were created and a drop in price occurred.

    Stacks (STX) - 1D

    The price was bouncing from a trend line (it had bounced 3 times in total). But overall, the order block still hasn’t been mitigated and the way STX is losing steam, it might not bounce the next time it touches the trend line. If it drops to the order block, we can expect the price to shift structure. But this drop would only come into play if the trend line doesn’t hold. If it holds we can look for a bullish price movement, even if it is for a short period of time.

    Price Prediction – Stacks

    In the long run, STX is a good opportunity. According to the wallet investor, the price of Stacks is to reach a value of $3.419 in a year. For a five-year plan, the price will reach a value of $8.230. But the investors are even more bullish on the value and they think that it will reach even more.

  • FLOW Coin Drops down 8% today – What’s Next?

    FLOW Coin Drops down 8% today – What’s Next?

    According to coinmarketcap, the maximum supply of FLOW is around 1.3B tokens and the circulating supply is around 311.8M tokens. FLOW holds the 46th rank according to market cap and has a market dominance of 0.16%.

    At the time of writing, FLOW is being traded at the price of $13.08 with a drop of almost 7.91% in the last 24 hours. It is a really strong token fundamentally. The maximum and minimum today are $14.54 and $12.89 respectively. The daily trading volume has also increased by almost 71.75%. It had created its ATH in July 2021 and reached a price of almost $35.61. During the crash, the price has dropped down to a level of $11.55. The price is still near the bottom and hasn’t done much.

    Technical Analysis – Flow (FLOW)

    The chart of the price is quite neat at the moment. On the daily time frame, we can see that Flow was continuously facing rejection from the trend line. But recently the price has broken out of the range and has shown a drop in its price.

    We have seen the presence of liquidity which can drop the price down to a lower level. After it has happened we can expect the price to show reversal from that point.

    Flow (FLOW) - 1D Chart

    The target for this movement would be around the 1D order block. The price can move to that level and we can expect a reaction from the price at that point. The price of Flow has already broken out but we can expect a retest which would also serve as a method to grab the liquidity below. Overall the short-term sentiments for the price are quite bullish and we can soon expect higher highs and lows.

    Long Term Investment

    In the long run, people are quite hopeful about the price. They think that it is going to attract an even more audience that is going to make it even more mainstream.

    But according to the wallet investor, in a four-year plan, Flow is supposed to drop down to a price of $1.933 which is quite less than the price that Flow has right now. As opposed to the general mindset of the investors and retailers this is quite an opposite perspective and this calls for Flow to be not a good investment. But people are hopeful that Flow will achieve new heights in the near future.

  • Elrond (EGLD) Coin – Time to retrace back?

    Elrond (EGLD) Coin – Time to retrace back?

    The native token of Elrond network is Egld that is used in staking and paying network fees and rewarding validators. At the time of writing Egld is being traded at the price of $356.88. The price has increased by almost 15.68% in the past 24 hours. Egld is listed on coinmarketcap on the 30th spot and has a market dominance of about 0.27%. The past 4 months have been extremely bullish for the price.

    This month alone we have seen an increase of about 31.83% in the price. 4 months ago Egld was being traded at the price of around $86.86 and now it is near its All-Time High. EGLD created it all-time high around the price of $369.61 during this month. Egld has a limited supply with a base at 20M Egld and new tokens are minted to reward the validators.

    Technical Analysis 

    Elrond (EGLD) has been printing green candles for the past 8 hours. On the four-hour time frame, we see that the price was forming an inverse cup and handle formation. During this formation, the price was supposed to drop (high probability) but instead it grabbed the liquidity and rallied upwards, and broke the structure during this movement as well.

    During this rally upwards, the price had created an order block which is unmitigated at the moment. Aso due to this momentous move upwards, we see that the price has left quite an imbalance there which can drop the price down to the level of the daily order block.

    Egld (4H)

    A confirmation of this move would be that Elrond (EGLD) breaks the structure which would eventually lead to a drop in the price.  Moreover, if the daily order block holds then we can expect that the price would move upwards and it wouldn’t be long before we see a new all-time high, otherwise, we can expect lower price levels as well.

    Long Term Prediction – Elrond (EGLD)

    Elrond (EGLD) is a highly bullish project. According to the wallet investor, the price is expected to reach a value of $525.372. For five years, the price is expected to reach a level of $1357.070.

  • Holo (HOT) Coin – On its way to Create a Higher High?

    Holo (HOT) Coin – On its way to Create a Higher High?

    The native token of Holo is named HOT. At the time of writing HOT is being traded at the price of $0.01284. The price has increased by almost 11.67% in the past 24 hours. The daily trading volume of HOT has also increased by almost 123% today. HOT is listed on coinmarketcap on the 68th spot and has a market dominance of about 0.09%. The past month i.e. October just like a lot of other coins has been bullish for HOT and we have seen an increase of about 77.02% in October. This monthly candle is bearish and has seen a drop of 9.44%.

    HOT had created its all-time high around the price of $0.03160 in the month of April 2021. The maximum supply of HOT is around 177B HOT while the circulating supply is around 172.9M HOT (according to coinmarketcap). Nearly all the coins are in circulation now.

    Technical Analysis – Holo (HOT)

    On the daily time frame, we can see that the price was moving upwards and shot upwards to break the structure. This resulted in a new high of the price. Now when the price went parabolic it left an order block behind.  Soon after the new high, the price started to take rejections and started to clearly respect a line. As such it grabbed the liquidity present above and slowly started to retrace back to the daily order block.

    HOT - DTF

    Soon the price went to mitigate the order block and now there is no visible reason for the price to come down again. We can expect a beautiful rally from HOLO at this point which would eventually lead to a new high. Invalidation of this scenario would be failing of the price to bounce from this zone which at the moment seems highly unlikely to happen.

    Price Prediction – Holo

    HOT has been one of the highly bullish coins currently. The platform offers solutions that connects dApps built on Holochain to be connected with the mainstream internet. According to the wallet investor, the price of Holo (HOT) is expected to reach a value of $0.0230 and in five years the price is expected to reach a level of $0.06083. As compared to the current times this is the price doing many times, but the traders think that it would be much more than what is being expected.

  • Fantom (FTM) Coin –  How can the Price behave Now?

    Fantom (FTM) Coin –  How can the Price behave Now?

    According to coinmarketcap, the maximum supply of FTM is around 3.175B FTM and the circulating supply is around 2.55B FTM. FTM holds the 39th rank according to market cap and has a market dominance of 0.22%.

    At the time of writing, FTM is being traded at the price of $2.17 with an increase of almost 12.94% in the last 24 hours. FTM is a really strong token fundamentally. The maximum and minimum today are $2.21 and $1.77 respectively. The daily trading volume has also increased by almost 71.75%. FTM had created its ATH in October 2021 and reached a price of almost $3.4842. During the crash, the price of FTM dropped down to a level of $0.1530. The price has almost done 15 times since the creation of the bottom.

    Technical Analysis –  Fantom (FTM)

    Fantom (FTM) has been a highly bullish coin but recently as it can be seen that the coin has shifted the market structure as shown in the chart. The chart shows that it had broken many structures and kept the uptrend till it reached the point of its recent high where it faced severe rejection. The price did try to attack the level again but it couldn’t hold it and it fell down leaving tons of liquidity above the line.

    Now one thing to notice is the creation of two order blocks, one above the current price and one below the price. The market can move in such a way that it will tackle the order block above and then move on to the lower time frames. From where a possible long can be taken upon a retest of the zone.

    FTM - DTF

    It is to remember that overall the price is highly bullish and we can expect the price to move upwards soon. Only on the lower time frames, noise is visible but zooming out gives quite a clear view about the price movement.

    Long Term Price Prediction – Fantom (FTM)

    FTM is a really strong token. It provides decentralized finance solutions to developers. As a result, we can expect growth in the price in the future. According to wallet investor, it is expected to reach a value of around $4.518 in a year and is expected to reach a value of $12.324 in five years.

  • Enjin (ENJ) Coin – A Gaming Platform that has Pumped Hard

    Enjin (ENJ) Coin – A Gaming Platform that has Pumped Hard

    The advent of blockchain technology has opened new avenues for people to connect with others.  One way that this is being done is through the online gaming scene. This, coupled with the increased interest of major corporations in the metaverse, the crypto-gaming platform has taken the world by storm. Enjin (ENJ) is one such project.

    Enjin that is powering the ENJ coin is also one of those companies that are trying to take hold of the gaming space opened through crypto-networks and Non-Fungible Tokens (NFT). Built on the Ethereum blockchain, the game enables its players to earn money through playing the game. With this, the hours that were “materially wasted” can on recreational activities be turned into profit.

    Using Enjin (ENJ), NFTs can be made and then sold.  This is done through Enjin providing a social gaming platform. Through this platform, the NFTs earned within the game can be stored in the vaults. Developers have the option to create in-game accessories and products through the platform. These products can be bought, sold, traded, or used within the virtual world.  The developers are given software development kits (SDKs) have been given to developers so that each can add their own unique flavor and identity to the software.

    Enjin (ENJ) has a weird relation with the whole market. Most altcoins follow the trajectory of Bitcoin. But Enjin seems to show an opposite direction. It might be because ENJ is a gaming token.  Other factors may include the rebranding of Facebook incorporated as Meta and the high earning of all the investors with all their bullish performance of the coin with 97% of the investors making money.

    Current Price Movement – Enjin (ENJ)

    At the time when this article is being written, the value of the Enjin (ENJ) coin is $3.50 (a 21% increase over the past twenty-four hours) with a trading volume $1,385,742,744 with an increase of 92.44% over the past twenty-four hours. In just the last month, the coin has gone from its value of $1.68 to its current value which is also at its all-time high. The total and maximum supply of the coin is 1 million ENJ tokens out of which 853,108,659.57 ENJ are in circulation.

    Enjin (ENJ) has recently formed a $100 million Efinity Metaverse Fund to formalize support for their ecosystem partners and help make the decentralized Metaverse a reality. Unlike the metaverse of Facebook (which Enjin claims want to become an internet despot), the Enjin metaverse is planning to be decentralized.