Tag: Technical Analysis

  • Stellar (XLM) –  What is the Chart Showing Us?

    Stellar (XLM) –  What is the Chart Showing Us?

    At the time of writing XLM is being traded at the price of $0.2769. The price of the coin has increased by almost 4% in the past 24 hours. The maximum and minimum of the day are around $0.2772 and $0.2614. The daily trading volume has on the other hand has decreased by almost 27.28% in one day. XLM is listed on coinmarketcap at the 26th spot according to market capital and has a market dominance of 0.30%.

    XLM before the crash had achieved its all-time high around the price of $0.7985 in May 2021. During the crash, it created a bottom and dropped down to $0.1985 in the month of July. Just like many other coins, the coin showed reversal but it wasn’t strong enough. XLM is still being traded at the price it had around July.

    XLM has a total supply of around 50B tokens and has nearly half of them in the circulation i.ie around 24.67B. The coin can be traded at a lot of different exchanges such as KuCoin, Binance, Hotbit, FTX.

    Technical Analysis – Stellar (XLM)

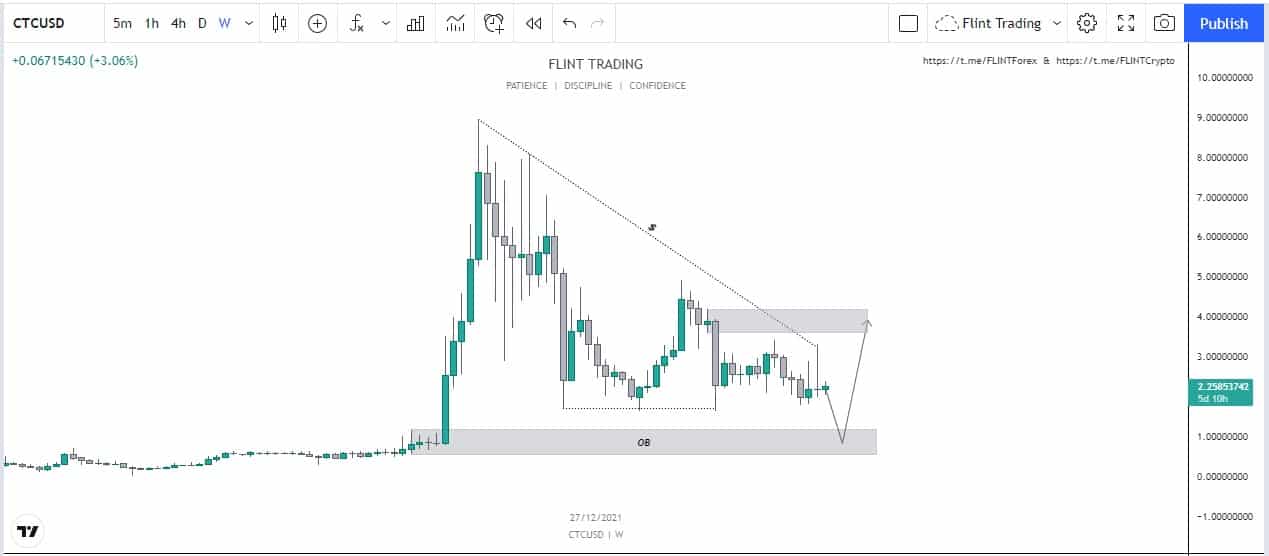
    It can be seen that the coin has lost its structure and is now falling down. At one point it was creating higher highs and higher lows. It failed to maintain that level and the structure shifted. It can be seen that the price of XLM has been printing lower lows and it can be seen that it was clearly following a trend line. XLM had touched it two times and showed reaction from there both of the times

    XLM -1D

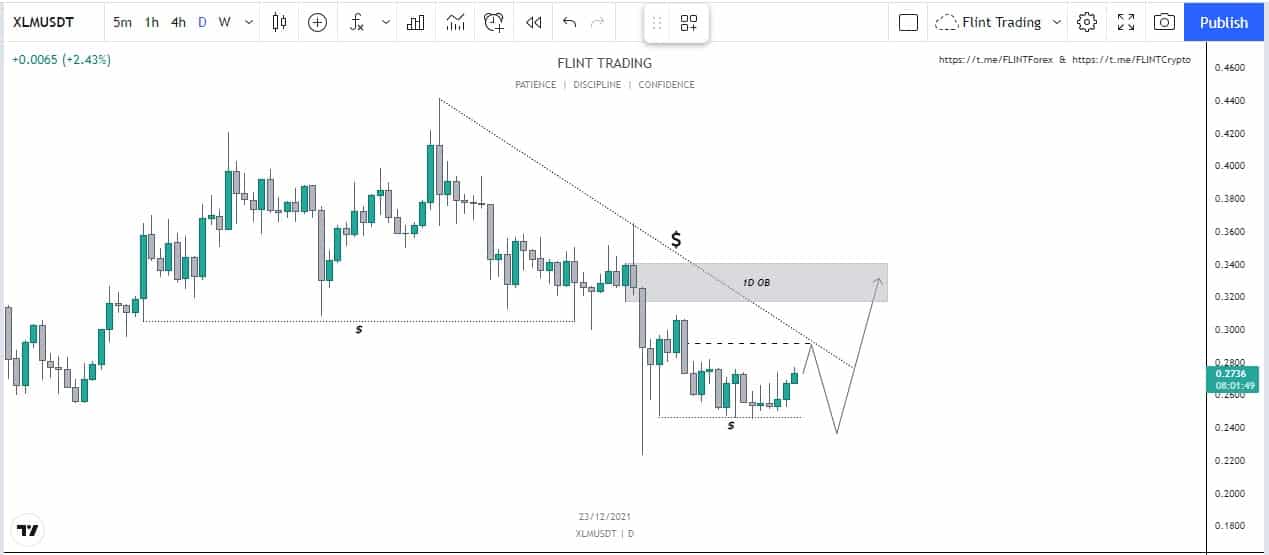
    Now there is an order block that can pose a reaction to the price movement. Now, there is liquidity below by the equal lows. We can expect that the price will go up and have a reaction from the trend line. From there, it can drop down to grab the remaining liquidity. After this, the price can have a shot upwards. If the momentum is strong enough, XLM can break the trend line and move upwards to touch the order block.

    Price Prediction – Stellar (XLM)

    Stellar(XLM) has been one of the highly bullish coins in the market. According to wallet investor, XLM in one year is expected to reach a value of $0.484. In five years, it is expected to touch $1.351. This shows that XLM has a huge amount of potential in it and would give an amazing return to the people who would hold it.

  • The Graph (GRT) – On its way to $1?

    The Graph (GRT) – On its way to $1?

    The native token of The Graph Ecosystem is GRT

    At the time of writing, GRT is being traded at the rate of $0.7219 with an increase of almost 10% within the last 24 hours.

    The low within this tenure was around $0.6592 and the high was approximately $0.7302. The coin as being in the watchlist of many traders makes it rank all the way up to number 47th according to the latest data released by coin market cap.

    GRT during the month of February approached a near All-time High around the price of $2.8807. The trading volume today on the other hand has increased by almost 33.62%.

    The top exchanges for trading GRT are currently Binance, OKEx, FTX

    Technical Analysis –  The Graph (GRT)

    GRT has been dropping hard for a long time. For a long time, the price of GRT has shown reversal and started to a dropdown. This happened when the price failed to hold the level and couldn’t create a new higher high. The price dropped down and went into consolidation for a few days.

    The price of GRT did print a green candle but wasn’t enough to create a reversal in the price and soon the trend continued towards the downside. This is an important part of the price now.

    GRT - 1D

    After this, the price went down and grabbed liquidity present below before doing a descending correction. Now what we can expect from the price is that it can go up and mitigate the equilibrium position. From there we can look for lower time confirmations and additional confirmations to know how it can react. Overall, the price action of GRT is now bullish and we can be pretty sure that the structure has reversed.

    If the price drops down we can expect another leg upwards which would eventually take the price to the consolidation range. From there, we can expect another reaction to the price. If it becomes stable over that point, we can look for another higher high, otherwise, the price can drop down to the level below.

    Price Prediction – The Graph (GRT)

    GRT has been one of the slow gainers in the market. The price is still way low as compared to the all-time high.  According to wallet investor, the price of GRT is to reach a value of $0.333 in a year. This means that according to wallet investors GRT is a bad investment.

  • Polygon (MATIC) – Where will it move Now?

    Polygon (MATIC) – Where will it move Now?

    According to coinmarketcap, the total supply of MATIC is around 10B MATIC and around 7.09B of the MATIC are in circulation at the moment. It holds the 14th rank according to market cap and has a market dominance of 0.80%.

    At the time of writing MATIC is being traded at the price of $2.60 with an increase of almost 12.57% in the last 24 hours. The maximum and minimum today are $2.61 and $2.28 respectively. The daily trading volume has increased by almost 45.52%. MATIC had created its ATH in May 2021 and reached a price of almost $2.70. The price during the crash dropped down to a price of almost $0621 in the month of July 2021. Overall the price is moving for higher highs. In November, we saw a decrease of almost 8%. This month, we have seen an increase of almost 43%.

    Technical Analysis – Polygon 

    MATIC has been one of the most bullish coins, it can be seen that the price of the coin is near its all-time high value. The coin has been printing higher lows and higher highs for a long time. We can see that the price has been grabbing liquidity below. It continued to go upwards and touched the last higher high (as can be seen on the chart).

    Now what we can expect from the chart of MATIC is that it can go upwards and touch the all-time value. From there it can have some reaction from the value. If it becomes stable we can look for a higher high.

    More importantly, a point of interest is the fact that these last two candles have created inefficiency in the price. The second thing is the creation of an order block. We can expect that it would go upwards, create a new all-time high, and come back down to fill the gap.

    MATIC - 1D

    Price Prediction – Polygon (MATIC)

    MATIC is a good investment and is going to provide great returns. Wallet investor considers MATIC to be a really good investment as well. According to them, in a year the price is expected to reach a value of $4.056. In five years the price is expected to reach a value of $11.627. Traders on the other hand are very bullish on the price and think that it wouldn’t be long before MATIC moves up to create a new ATH.

  • SHIBA INU (SHIB) – What is the Chart Showing Us?

    SHIBA INU (SHIB) – What is the Chart Showing Us?

    At the time of writing, SHIB is being traded at the rate of $0.00003251 with an increase of almost 10.27% within the last 24 hours.

    The low within this tenure was around $0.00003096 and the high was approximately $0.00003256. The coin as being in the watchlist of many traders makes it rank all the way up to number 13th according to the latest data released by coin market cap.

    SHIB made its all-time high in the month of October 2021 where it reached an enormous amount of $0.00008854. At the moment it has a daily volume of $1,977,020,253 with an increase of about 141.63% within the last 24 hours. The total supply of SHIB is now around 589T and the circulating supply is also 549B. SHIB has a dominance of 0.79%.

    The top exchanges for trading it are currently Binance, OKEx, FTX.

    Technical Analysis – SHIBA INU (SHIB)

    SHIB has been one of the highest gainers at one point. We can see that the SHIB has a highly explosive move upwards. This has resulted in the price to achieve new heights and create a new all-time high. We can see that after the price went to touch the ATH, it dropped really fast.

    SHIB - 1D

    The price broke the structure and came down creating lower lows and lower highs. At one point, it had wicked upwards and grabbed the liquidity present above but it soon fell down. Now it can be seen that the SHIB bears are losing steam. Moreover, the price has also mitigated the order block present below.

    Now there is no visible reason for the price to go down again. It is possible that the price of SHIB can long here. For the target, we can look for the wick that happened a few days ago. The price can mitigate half of that candle.

    Price Prediction – SHIBA INU

    SHIB has been one of the most successful meme coins. The people have gained a lot, based on this coin. In the long run, traders are highly bullish on the project. The price is currently at the same level where it was in June and has completely retraced back. According to the wallet investor, SHIB is a good investment. The price of the coin is to reach a value of $0.000088 in a year. In five years, the price is expected to reach around $0.000316.

  • Radix (XRD) –  What is the Chart Showing Us?

    Radix (XRD) –  What is the Chart Showing Us?

    At the time of writing, XRD is being traded at the price of $0.2739. The price of the coin has increased by almost 14% in the past 24 hours. The maximum and minimum of the day are around $0.281 and $0.2324. The daily trading volume has on the other hand has increased by almost 63% in one day. XRD is listed on coinmarketcap at 203rd spot according to market capital and has negligible market dominance.

    XRD before the crash had achieved its all-time high around the price of $0.14 in August 2021. During the crash, XRD created a bottom and dropped down to $0.098 in the same month. Just like many other coins, the coin showed reversal and it wasn’t long before XRD created a new all-time high in the month of November and reached a price of $0.65

    XRD has a total supply of around 24B tokens and has nearly half of them in the circulation i.ie around 12.12B. XRD can be traded at a lot of different exchanges such as KuCoin, Binance, Hotbit, FTX.

    Technical Analysis – Radix (XRD)

    According to the daily time frame, we can see that XRD had an explosive upwards, this move has taken the coin to new heights. The price went to touch new high where it failed to hold the level and ultimately broke down. Price broke the structure that resulted in the free fall of the price.

    XRD - 1D

    The price of XRD quickly fell down and touch the bottom. This fall has created an order block. This block is still unmitigated. Now what can happen is that price can move upwards and touch the break of structure point.

    When it touches that point, we can look for multiple scenarios. If the price becomes stable above. We can look for a possible long. But the unmitigated zone, that is present below can drive the price down. Lower time frame confirmations should be taken into consideration to take a possible entry.

    Price Prediction – Radix (XRD)

    Radix(XRD) has been one of the highly bullish coins in the market. According to wallet investor, XRD in one year is expected to reach a value of $1.501. In five years, it is expected to touch $6.543. This shows that the coin has a huge amount of potential in it and would give an amazing return to the people who would hold it.

  • Creditcoin (CTC) – Where will it move Now?

    Creditcoin (CTC) – Where will it move Now?

    According to coinmarketcap, the total supply of CTC is around 2B CTC and around 564M of the CTC are in circulation at the moment. It holds the 211th rank according to market cap and has negligible market dominance.

    At the time of writing, CTC is being traded at the price of $2.25 with an increase of almost 9.25% in the last 24 hours. The maximum and minimum today are $2.00 and $2.35 respectively. The daily trading volume has decreased by almost 0.45%. CTC had created its ATH in March 2021 and reached a price of almost $9.10. The price during the crash dropped down to a price of almost $1.010 in the month of May 2021. Overall the price is moving to higher highs. In November, we saw a decrease of almost 5.25%. This month, we have seen a decrease of almost 10%.

    Technical Analysis – Creditcoin (CTC)

    It can be seen, that the price had been consolidating for the while, the price of CTC had been ranging for a while before shooting upwards. This shot upwards created an order block. Now, this order block is on the weekly time frame. The price went on to create five green candles that went up to touch and create a new all-time high.

    CTC - 1W

    The price of CTC after that failed to create a new high and dropped down to create a bottom. This resulted in the shift of the structure. The price went down and has created equal lows three times. This means that there is a liquidity blow-up for the grab.

    The second-order block that is worth noticing is the one that resulted in the fall of the price. Now what can happen is that the price can drop down to mitigate the order block present below in confluence with the liquidity present below. From there we can rise up to touch the order block present above.

    Price Prediction – Creditcoin

    CTC is a good investment and is going to provide great returns. Wallet investor considers CTC to be a really good investment as well. According to them, in a year the price is expected to reach a value of $4.364. In five years the price is expected to reach a value of $13.129. Traders on the other hand are very bullish on the price and think that it wouldn’t be long before CTC moves up to create a new ATH.

  • WAVES – What is the Chart Showing Us?

    WAVES – What is the Chart Showing Us?

    At the time of writing WAVES is being traded at the rate of $15.93 with an increase of almost 3% within the last 24 hours.

    The low within this tenure was around $14.93 and the high was approximately $15.95. The coin as being in the watchlist of many traders makes it rank all the way up to number 74th according to the latest data released by coin market cap.

    WAVES made its all-time high in the month of May 2021 where it reached an enormous amount of $41.86. At the moment it has a daily volume of $95,849,064 with a decrease of about 22.32% within the last 24 hours. The circulating supply of WAVES is now around 107M and the maximum supply is also 107M. WAVES has a dominance of 0.08%.

    The top exchanges for trading it are currently Binance, OKEx, FTX.

    Technical Analysis – WAVES

    The coin has one of the cleanest charts. It can be seen that as long as the price was bullish and in the uptrend, it carried onwards and mitigated two times a lower position. The price had bounced back from this level and went on to create a new high.

    WAVES - 1D

    After it failed to hold the next level, it dropped down and went into a downtrend. Now we can see that before all this (it can be seen at the start of the chart) that the price had created an order block that is present way before. This daily order block has remained unmitigated till now.

    Now what can be seen is that the price of WAVES showed a reversal and bounced without touching the order block. This movement was short-lived and the price is once again coming down. We can expect the price to touch the order block. From there a possible long can be taken depending on the overall market conditions.

    Price Prediction

    The coin had achieved a huge value of $41.86 before the crash. Unfortunately, it hasn’t been able to recover from the damage. In the long run, traders are highly bullish on the project. The price is currently at the same level where it was in June and has completely retraced back. According to the wallet investor, WAVES is a good investment. The price of the coin is to reach a value of $34.327 in a year. In five years, the price is expected to reach around $108.579.

  • BORA – Where is the Price Going?

    BORA – Where is the Price Going?

    The native token of BORA Ecosystem is BORA.

    At the time of writing BORA is being traded at the rate of $1.02 with an increase of almost 4.19% within the last 24 hours.

    The low within this tenure was around $0.9471 and the high was approximately $1.05. The coin as being in the watchlist of many traders makes it rank all the way up to number 96th according to the latest data released by coin market cap.

    BORA during the month of November approached a near All-time High around the price of $1.55. The trading volume today on the other hand has increased by almost 66.68%.

    The top exchanges for trading BORA are currently Upbit, Coinone, Bithumb

    Technical Analysis –  BORA

    The coin a few days ago had a really large candle that took it to a new high. After the creation of the new high, the price failed to create a new higher high and ultimately broke the structure. The price then went to do a descending creation. The price went to mitigate a new higher high. From there it went to touch to zone and is going down as the price failed to hold the zone.

    It can be seen that when the price went upwards and printed the green candle, it left an imbalance in the price. Now this imbalance has been unmitigated for a long time.

    BORA - 1D

    Now the price has no reason to go upwards, as it has failed to hold the zone. There are two reasons that can drive the price of BORA downwards. First is the imbalance present in the candle that needs to be filled. The second is the presence of liquidity that hasn’t been grabbed till now. These two reasons, can drive the price downwards and mitigate the level.

    After this mitigation, the price can become stable from where it can shoot upwards. This place can be a place for a possible long to be taken that can result in good profits.

    Price Prediction

    BORA has been one of the highly bullish coins in the market. In just a few months we have seen a massive increase in the price of BORA. According to wallet investor, the price of BORA is to reach a value of $1.617 in a year. In five years, the price is expected to reach a value of $4.058.

  • Tron (TRX) –  What is the Chart Showing Us?

    Tron (TRX) –  What is the Chart Showing Us?

    At the time of writing, TRX is being traded at the price of $0.07789. The price of the coin has decreased by almost 6% in the past 24 hours. The maximum and minimum of the day are around $0.08131 and $0.07557. The daily trading volume has on the other hand has increased by almost 52% in one day. TRX is listed on coinmarketcap at the 25th spot according to market capital and has a market dominance of about 0.36%.

    TRX before the crash had achieved its all-time high around the price of $0.18 in April 2021. During the crash, TRX created a bottom and dropped down to $0.04637 in June. Just like many other coins, the coin showed reversal but the reversal wasn’t strong enough to lead the coin to the new ATH. It is still way below its ATH value.

    TRX has a total supply of around 101B tokens and has nearly all of them in the circulation i.ie around 101B. TRX can be traded at a lot of different exchanges such as KuCoin, Binance, Hotbit, FTX.

    Technical Analysis – Tron (TRX)

    Tron (TRX) at one point had been printing higher highs. After it failed to create a new higher high, the price broke the structure and the fall started.

    It can be seen that after the drop, the price of TRX started to make lower highs and lower lows. The price was respecting the trend line all the time. On the daily time frame, the price wicked down and quickly closed above.

    TRX - 1D

    Now, this wick down created the structural low. This low has remained unmitigated for a long time. Now the price is moving down to touch that level once again. Once it does, we can expect a long from there. The price can then shoot upwards and touch the imbalance left above. At that point, we can expect a reaction from the market, and most probably we can drop down and continue the downwards trend.

    Price Prediction – Tron (TRX)

    Tron(TRX) has been one of the highly bullish coins in the market. According to wallet investor, TRX in one year is expected to reach a value of $0.146. In five years, it is expected to touch $0.4097. This shows that TRX has a huge amount of potential in it and would give amazing returns to the people who would hold it.

  • Curve Dao Token (CRV) – Where will it move Now?

    Curve Dao Token (CRV) – Where will it move Now?

    According to coinmarketcap, the total supply of CRV is around 1.35B CRV and around 437M of the CRV are in circulation at the moment. It holds the 69th rank according to market cap and has a market dominance of about 0.213%.

    At the time of writing, CRV is being traded at the price of $4.25 with an increase of almost 5% in the last 24 hours. The maximum and minimum today are $4.29 and $3.79 respectively. The daily trading volume has also increased by almost 45%. CRV had created its ATH in November 2021 and reached a price of almost $6.339. The price during the crash dropped down to a price of almost $1.057 in the month of July 2021. Overall the price is moving to higher highs. In November, we saw an increase of almost 13.5%. This month, we have seen a decrease of almost 21.5%.

    Technical Analysis – Curve Dao Token (CRV)

    It can be seen on the daily time frame, that the price of CRV had been printing red candles for the past two days. Before the new higher low and the lower low, the price was in a descending channel. The price did a fake-out and broke upwards but it couldn’t support itself and the price dropped.

    CRV - 1D

    CRV went on to create a new lower low and that broke back into the channel. During this, the price had created an order block that remained unmitigated for a long time. This level got touched two days ago and CRV had a reaction from this price.

    Now there is no reason for the price of CRV to go up and we can expect the drop now. Lower time frame confirmations should be taken into consideration to have a cleaner entry in the price. It can be a long if the price gets rejected from the trend line.

    Price Prediction – Curve Dao Token (CRV)

    CRV is a good investment and is going to provide great returns. Wallet investor considers it to be a really good investment as well. According to them, in a year the price is expected to reach a value of $15.544. In five years the price is expected to reach a value of $6.398. Traders on the other hand are very bullish on the price and think that it wouldn’t be long before CRV moves up to create a new ATH.