Tag: Technical Analysis

  • Cosmos (ATOM) declines 15.38% today – What Now?

    Cosmos (ATOM) declines 15.38% today – What Now?

    At the time of writing ATOM is being traded at the rate of $25.91 with a decrease of 15.38% within the last 24 hours.

    The low within this tenure was around $25.84 and the high was approximately $31.27. The coin as being in the watchlist of many traders makes it rank all the way up to number 30th according to the latest data released by coin market cap.

    ATOM made its all-time high in the month of September 2021 where it reached an enormous amount of $44.80. At the moment it has a daily volume of $841,821,852 with an increase of 122.96% within the last 24 hours. The circulating supply of the coin is now around 225M and the maximum supply is 283M. ATOM has a dominance of 0.26%.

    The top exchanges for trading ATOM are currently KuCoin, Gate.io, Binance, Hotbit.

    Technical Analysis – Cosmos

    Cosmos (ATOM) has been one of the most highly bullish coins in the market. The fundamentals are super strong for this which would eventually lead the price in the three digits.

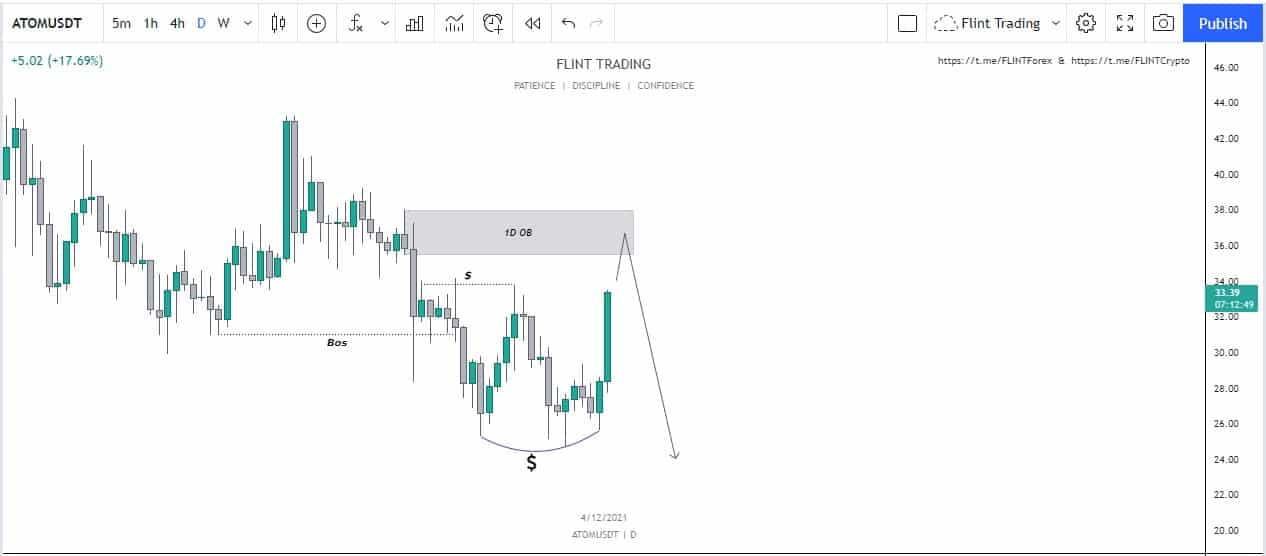
    ATOM has broken down the structure and is falling now. The price when broke down started to make a double bottom. The candle today is highly momentous and we have seen a solid increase of 20% in the price up till now.
    ATOM - 1D

    Now there are two possible price movements. The price when it dropped down created an order block which can drive the price upwards (which it has).

    Now ATOM can touch the order block. When it does we should be on the lookout for additional confluences. If the price becomes stable above this level, we can expect it to increase in price and reach new heights. If the price rejects from this level we can look for a possible short that will lead us to below the last lower low.

    Price Prediction – Cosmos (ATOM)

    In the long run, ATOM is a highly good opportunity. In August ATOM was being traded at the price of around $12 and now it has nearly tripled. According to the wallet investor, the price of ATOM is to reach a value of $50.504 in a year. For a five-year plan, the price will reach a value of $143.553. The way the price of ATOM has grown, the traders are even more bullish on the value and they think that it will reach even more.

  • Stellar (XLM) –  What is the Chart Showing Us?

    Stellar (XLM) –  What is the Chart Showing Us?

    At the time of writing XLM is being traded at the price of $0.2801. The price of XLM has decreased by almost 22.35% in the past 24 hours. The maximum and minimum of the day are around $0.3634 and $0.3213. The daily trading volume has also increased by almost 123.91% in one day. XLM is listed on coinmarketcap at 24th spot according to market capital and has a market dominance of about 0.33%.

    XLM before the crash had achieved its all-time high around the price of $0.7985 in May 2021. During the crash, XLM created a bottom and dropped down to $0.1985. As compared to other coins XLM has been one of the slow gainers but it is still comparatively closer to the bottom than the ATH.

    XLM has a total supply of around 50B tokens and has a circulating supply of around 24.6B coins. XLM can be traded at a lot of different exchanges such as Binance, crypto.com, OKEx, Huobi with different trading pairs.

    Technical Analysis – Stellar (XLM)

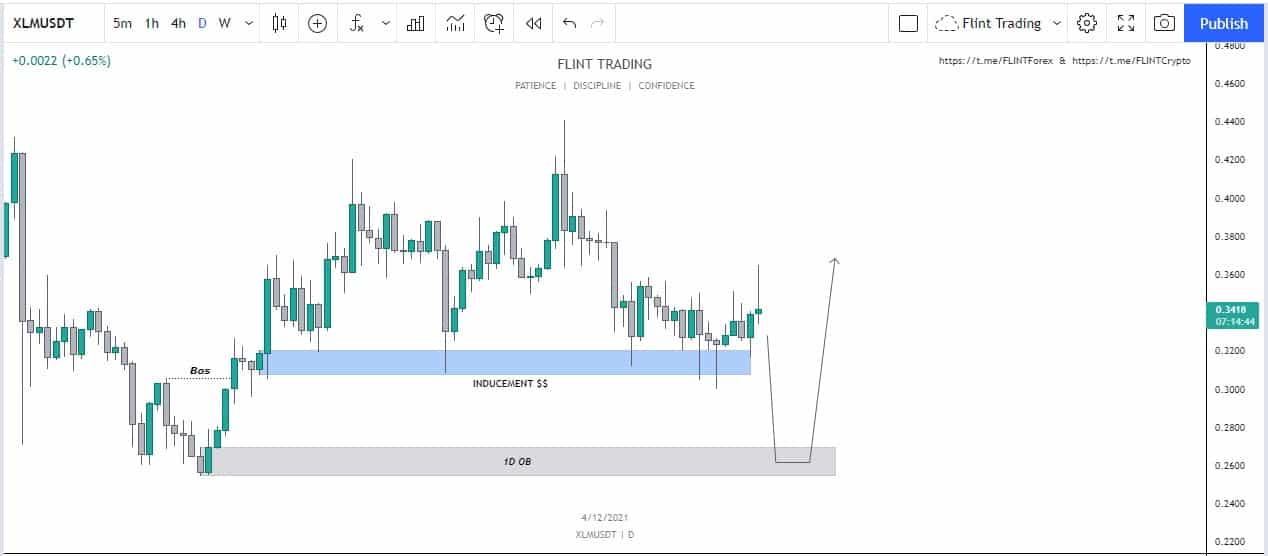
    On the daily time frame, we can see that the price has found strong support. The price has bounced from this level at many points. This level came into existence after the price broke the structure. This level is now crucial for the price to hold.

    Now the price is on its way to going for a higher high. XLM is still above this level. Now there are two possible movements for the price.

    XLM -1D

    One possible movement is that the price would move on to create a higher high and this would retain the bullish structure of the price.

    The other price movement would be the price to break this level. If it breaks, this would open another range for the price to move in. This can result in the price dropping down to the lower order block which hasn’t been mitigated up till now. If the price drops here, we can look for possible longs, if it holds this level, and depending on the LTF confirmations to have a clean entry in the market. The first target would be the upper order block.

    Price Prediction – Stellar

    Stellar(XLM) has been one of the highly bullish coins in the market. According to wallet investor, XLM in one year is expected to reach a value of $0.565. In five years, it is expected to touch $1.5195.

  • UNUS SED LEO – Where to Now?

    UNUS SED LEO – Where to Now?

    According to coinmarketcap, the total supply of LEO is around 985M LEO and the circulating supply is around 953M LEO. It holds the 52nd rank according to market cap and has a market dominance of about 0.13%.

    At the time of writing LEO is being traded at the price of $3.24 with a decrease of almost 7.76% in the last 24 hours. LEO is a really strong token fundamentally. The maximum and minimum today are $3.55 and $3.28 respectively. The daily trading volume has decreased by almost 11.96%. LEO had created its ATH in May 2021 and reached a price of almost $4.03. The price later dropped down to a price of almost $2.060. Since then the price started moving upwards and has been on the same trajectory since then. The past two months have been bullish. In October, we saw an increase of about 12.62% and in November, it was around 4.63%.

    Technical Analysis – UNUS SED LEO (LEO)

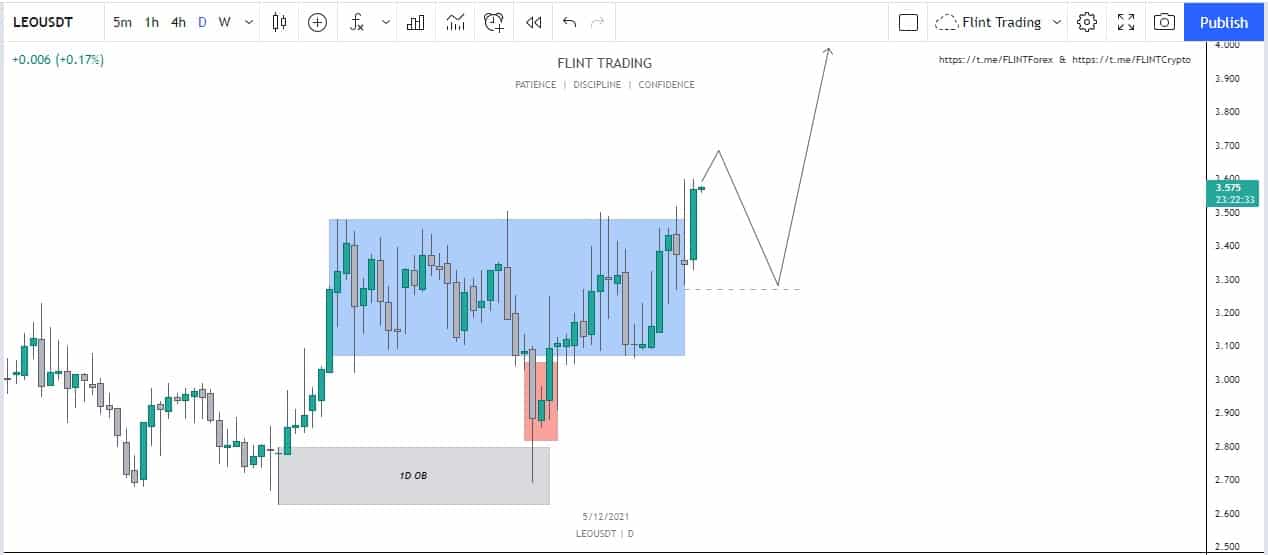
    LEO a few days back was dropping and printing lower low. Soon after, the price had a reversal. During this reversal, the price showed an impulsive move upwards. This move created an order block that remain unmitigated. The price increased continuously for a few days with good momentous candles. Soon after that, the price went into consolidation.

    LEO - 1D

    It can be seen that the order block was unmitigated for a long period of time. A few days after the consolidation, the price dropped down and mitigated the order block. Within a few days, the price was back in the range and consolidating again.

    Soon after the price has broken out of the consolidation zone. Now we can expect the price to rise up and then drop down to mitigate the middle level of the consolidation zone. After that, we can expect the price to rise again. Possible longs can be taken from this point. Invalidation of this case would be price dropping down and closing below to show a possible fakeout.

    Price Prediction – UNUS SED LEO (LEO)

    According to wallet investors, LEO is a good investment and is providing a great return. According to them, LEO is supposed to reach the value of $39.060 in a single year and in five years the price is expected to reach a value of $99.607. But people who trade are quite optimistic about the price and think that it would reach quite a high value.

  • Casper (CSPR) gains almost 12% Today

    Casper (CSPR) gains almost 12% Today

    At the time of writing this article, CSPR, the native token of Casper, has a value of $0.2114 (12.07% increase today) with a trading volume of $79,919,044 with an increase of about 3.63% over the past 24 hours. It has been of the top gainers today among the top 100 cryptocurrencies.

    CSPR is listed on coinmarketcap in 149th place. It has a market dominance of about 0.02%. CSPR had created its all-time high around the price of $66.44 in May 2021.  During the crash, the price dropped down to a level of $0.05 from where it showed reversal. The price is still increasing but it would be quite long before CSPR can touch a dollar.

    The maximum supply of CSPR is around 10B while the current circulating supply is around 2.76B coins.

    Technical Analysis – Casper (CSPR)

    On the monthly time frame, the price is dropping and we have seen a decrease of 7.52% this month. But considering the fact that CSPR gained 88.96% in the past month is remarkable.

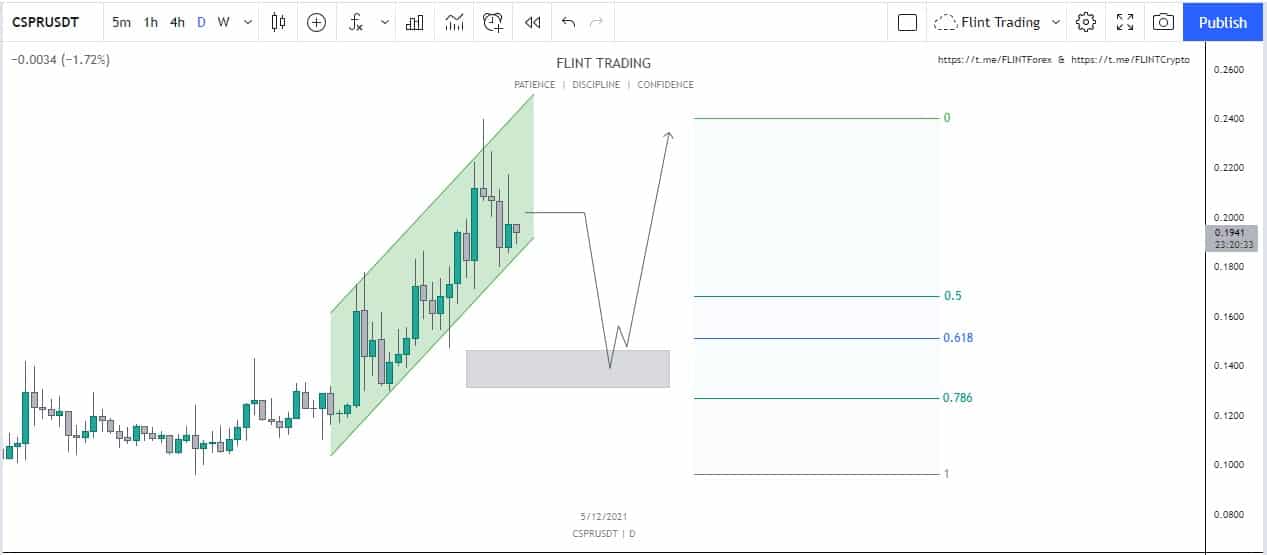
    On the daily time frame, we can see that the price has been printing higher highs on the daily time frame. It was following an ascending channel. It had been rejected two times from the channel but is still on the channel.

    After breaking the structural shift, the price left an order block that has still been unmitigated to date. Now the price is losing steam and momentum.

    CSPR - 1D

    There are two possible outcomes as to what the price may do now. If the price drops to the channel but gets bounced back, we can expect the price to rise up again. If CSPR drops down and fails to hold the level, we can expect the price to drop down and touch the order block present below.

    A confluence to the movement is the Fibonacci Retracement tool. The 0.786 and 0.618 zone is also present in the same area where the order block is present. From here, lower time confirmations should be taken into consideration to look for possible longs at that position. But this move will only be taken into consideration if CSPR fails to hold the level and drops down.

    Price Prediction – Casper (CSPR)

    According to the wallet investor, it is expected to reach the value of $0.0080 in a year. This means that according to their calculations and prediction Casper (CSPR) isn’t a good investment.

  • Kadena (KDA) – Where can the Price move Now?

    Kadena (KDA) – Where can the Price move Now?

    At the time of writing, KDA is being traded at the rate of $17.25 with an increase of 3.74% within the last 24 hours.

    The low within this tenure was around $16.75 and the high was approximately $18.80. The coin as being in the watchlist of many traders makes it rank all the way up to number 51st according to the latest data released by coin market cap.

    KDA made its all-time high in the month of May 2021 where it reached an enormous amount of $88. At the moment it has a daily volume of $63,878,766 with an increase of 17.44% within the last 24 hours. The circulating supply of KDA is now around 160M and a maximum supply of 1B. KDA has a dominance of 0.11%.

    The top exchanges for trading KDA are currently KuCoin, Gate.io, Hoo, Hotbit.

    Technical Analysis – Kadena

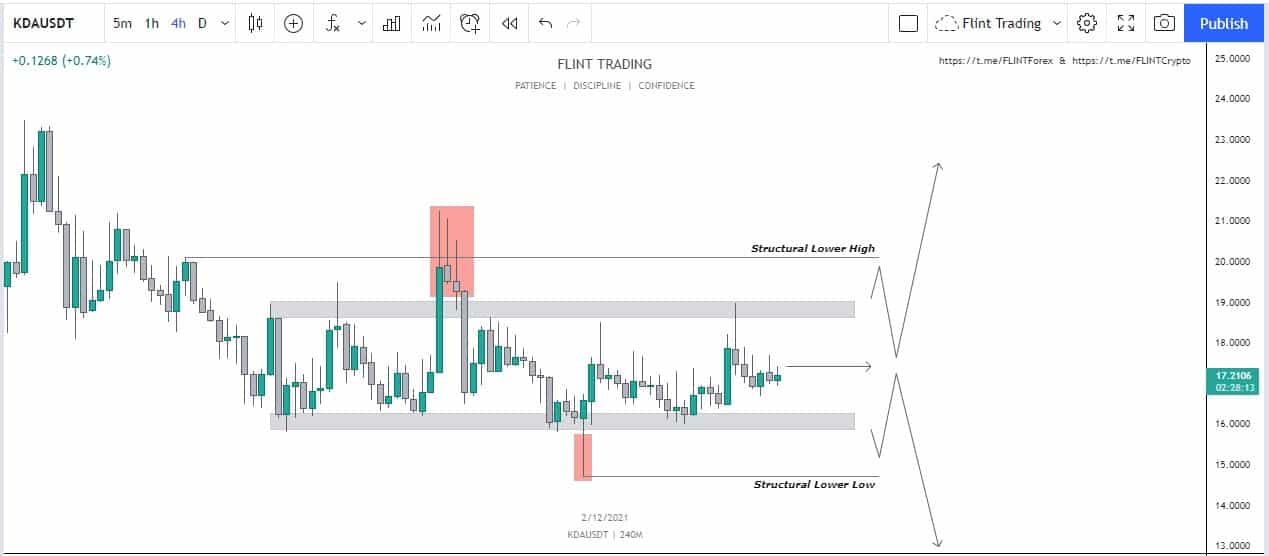
    Not much data is available on the daily time frame so choosing the 4H time frame to get a better idea about how the price may move.

    The price has a structural high and a structural low. The price has been moving between these two levels. There are two possible movements of KDA. One that it can move upwards and come down to retest the level from where we can look for possible longs.

    KDA -4H

    The second possible movement is the price to drop down and come back and face resistance to drop down from where possible shorts can be opened.

    It all depends on the lower time confirmations because the price movement is quite unclear at the moment. Sometime later, we can look for a better opportunity when the price becomes more clear.

    Price Prediction – Kadena (KDA)

    In the long run, KDA is a highly good opportunity. In September it was being traded at the price of around $0.74 and now it has crossed fifteen dollars. According to the wallet investor, the price of KDA is to reach a value of $33.136 in a year. For a five-year plan, the price will reach a value of $97.046. The way the price of KDA has grown, the traders are even more bullish on the value and they think that it will reach even more.

  • Uniswap (UNI) – Where can the price move now?

    Uniswap (UNI) – Where can the price move now?

    At the time of writing, UNI is being traded at the price of $22.37. The price of UNI has increased by almost 2.92% in the past 24 hours. The maximum and minimum of the day are around $22.73 and $20.57. The daily trading volume has also increased by almost 38.84% in one day. UNI is listed on coinmarketcap at 17th spot according to market capital and has a market dominance of about 0.54%.

    UNI before the crash had achieved it all-time high around the price of $2.70 in May 2021. During the crash, UNI created a bottom and dropped down to $45. As compared to other coins UNI has been one of the slow gainers but it is still comparatively closer to the bottom than the ATH. But the way it is moving. During the crash, it created a bottom of $13.

    UNI has a total supply of around 1B tokens and has a circulating supply of around 627M coins. UNI can be traded at a lot of different exchanges such as crypto.com, OKEx, Huobi with different trading pairs.

    Technical Analysis – Uniswap

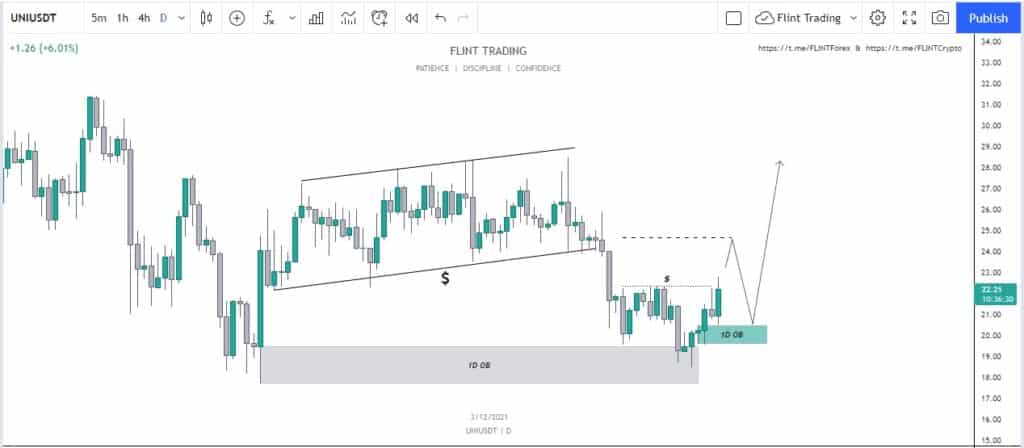
    On the daily time frame, UNI has one of the cleanest charts on the daily time frame. The price was making lower highs and lower lows and ultimately shifted the structure of the price. The price was consolidating for a lot of days. During the structural shift, the price printed a green candle and by doing this left an order block. This order block has now been mitigated.

    The price broke down from the accumulation phase and touched the order block. Now there is no reason for the price to the drop down. A smaller order block has also been created by the price to move upwards.

    UNI -1D

    A possible movement for the price is to move upwards and touch the trend line resistance. From there we can expect a possible reaction from the price. If the price from there drops down we can expect it to drop down to touch the new unmitigated order block. From there possible longs can be taken by taking confluences into consideration.

    Price Prediction – Uniswap(UNI)

    Uniswap(UNI) has been one of the highly bullish coins in the market. According to wallet investors, UNI in one year is expected to reach a value of $38.89. In five years, it is expected to touch $113.606.

  • OKB Coin – What is the Chart showing us?

    OKB Coin – What is the Chart showing us?

    According to coinmarketcap, the maximum supply of OKB is around 300M OKB and the circulating supply is around 60M OKB. It holds the 79th rank according to market cap and has a market dominance of about 0.06%.

    At the time of writing, OKB is being traded at the price of $27.14 with an increase of almost 5.87% in the last 24 hours. OKB is a really strong token fundamentally. The maximum and minimum today are $28.02 and $24.93 respectively. The daily trading volume has also increased by almost 22.75%. OKB had created its ATH in May 2021 and reached a price of almost $44.355. The price later dropped down to a price of almost $8.50. Since then the price started moving upwards and has been on the same trajectory since then. The past two months have been bullish. In October, we saw an increase of about 32.62% and in November, it was around 19.83%.

    Technical Analysis – OKB

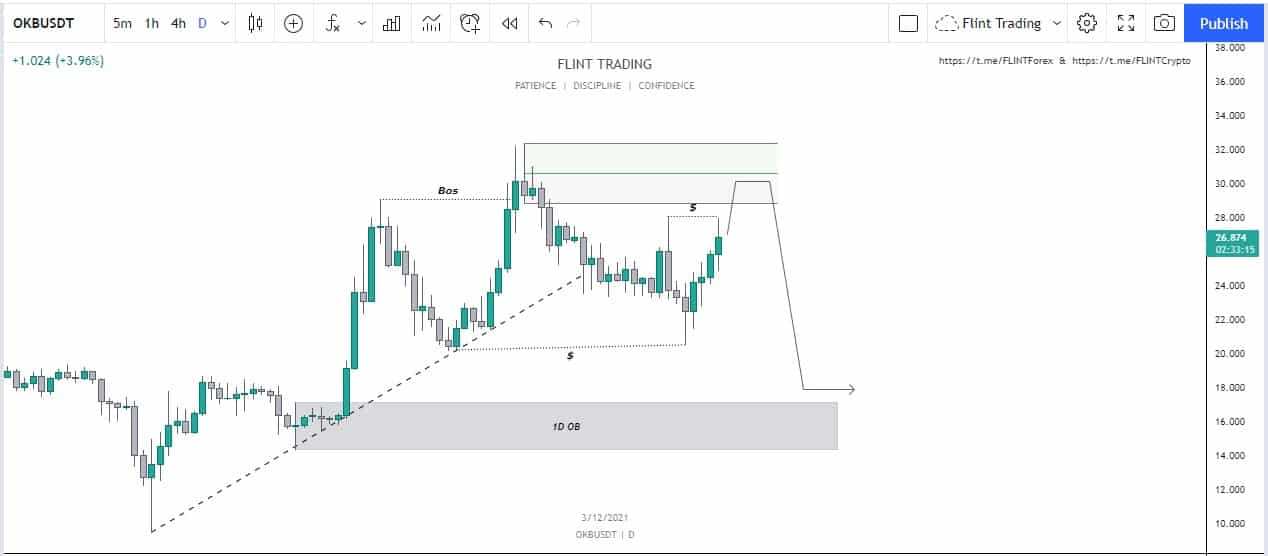
    On the daily time frame, we can see that the price has been continuously moving in the uptrend and making higher highs.

    The price was respecting the trend line and moving upwards. But soon, it failed to create another higher high and resulted in the break of structure. This break of structure initiated the fall. The price fell down to touch the last lower low from where it had bounced off. By doing this it had gotten the necessary fuel to move upwards.

    OKB - 1D

    Now the first hurdle in the way is the structural shift. If the price gets above it and becomes stable we can expect the price to continue moving upwards and create higher highs. In case the price fails and mitigates the top we can expect OKB to drop down and touch the order block below (which was formed by the impulsive move upwards). From there we can look for possible longs if we get enough confluences about the price movement.

    Price Prediction – OKB (OKB)

    According to wallet investor OKB is a good investment and is providing a great return. According to them, OKB is supposed to reach the value of $39.060 in a single year and in five years the price is expected to reach a value of $99.607. But people who trade are quite optimistic about the price and think that it would reach quite a high value.

  • Cardano (ADA) – On the Move?

    Cardano (ADA) – On the Move?

    At the time of writing this article, ADA, the native token of the Cardano network, has a value of $1.72 (9.53% increase today) with a trading volume of $2,504,946,661 with an increase of about 45.51% over the past 24 hours. It has been of the top gainers today among the top 100 cryptocurrencies.

    ADA is listed on coinmarketcap in 6th place. It has a market dominance of about 2.23%. ADA had created its all-time high around the price of $3.10 in September 2021.  During the crash, the price dropped down to a level of $0.9 from where it showed reversal. It wasn’t long before it went on to create a new all-time high.

    The maximum supply of ADA is around 45B while the current circulating supply is around 33.31B coins.

    Technical Analysis – Cardano (ADA)

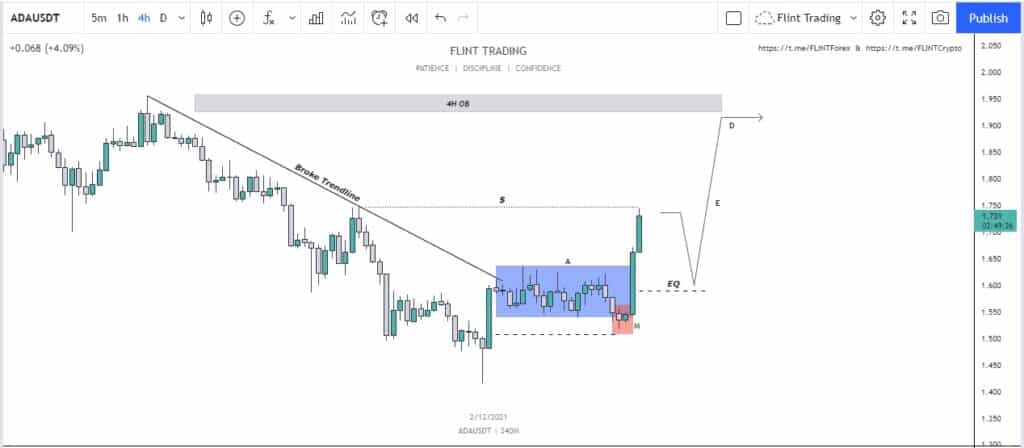
    Before the launch of their smart contract, ADA was creating its all-time high. After that, the price started to fall. It can be clearly seen that the price was following a trend line and it was dropping down. Soon after the price broke the trend line after getting rejected two times before.

    After breaking it, the price went into the accumulation phase. The candle that brought the price out of the trend line had an imbalance present. The price wicked down to mitigate the level and then it shot upwards. On the 4H time frame, we can see that the candles are momentous.

    ADA - 4H

    The point of interest is the level from where the price first got rejected before breaking out of the trend line. It can be expected for the price to get rejected again and drop down to full fill the imbalance. After that, we can expect the price to move upwards and long positions can be taken depending on the lower time frame confirmations. Invalidation would be price stabilizing above $1.7 and then we can expect the price to touch the daily order block.

    Price Prediction – Cardano

    The coin also seems to have a good future. Cardano has also launched their smart contracts in September and it wouldn’t be long before ADA becomes mainstream and dApps are made. It shows that it can go massive in the future. According to the wallet investor, it is expected to reach the value of $3.70 in a year. For five years, the price is expected to reach a value of $12.097.

  • Curve Dao (CRV) –  What is the Chart Showing Us?

    Curve Dao (CRV) –  What is the Chart Showing Us?

    According to coinmarketcap, the maximum supply of CRV is around 3B CRV and the circulating supply is around 433M CRV. It holds the 72nd rank according to market cap and has a market dominance of about 0.09%.

    At the time of writing, CRV is being traded at the price of $5.23 with an increase of almost 8.71% in the last 24 hours. CRV is a really strong token fundamentally. The maximum and minimum today are $5.48 and $4.59 respectively. The daily trading volume has also increased by almost 52.48%. CRV had created its ATH in August 2020 and reached a price of almost $23. The price later dropped down to a price of almost $0.4. Since then the price started moving upwards and has been on the same trajectory since then. The past two months have been bullish. In October, we saw an increase of about 89% and in December, it was around 15%.

    Technical Analysis – Curve Dao (CRV)

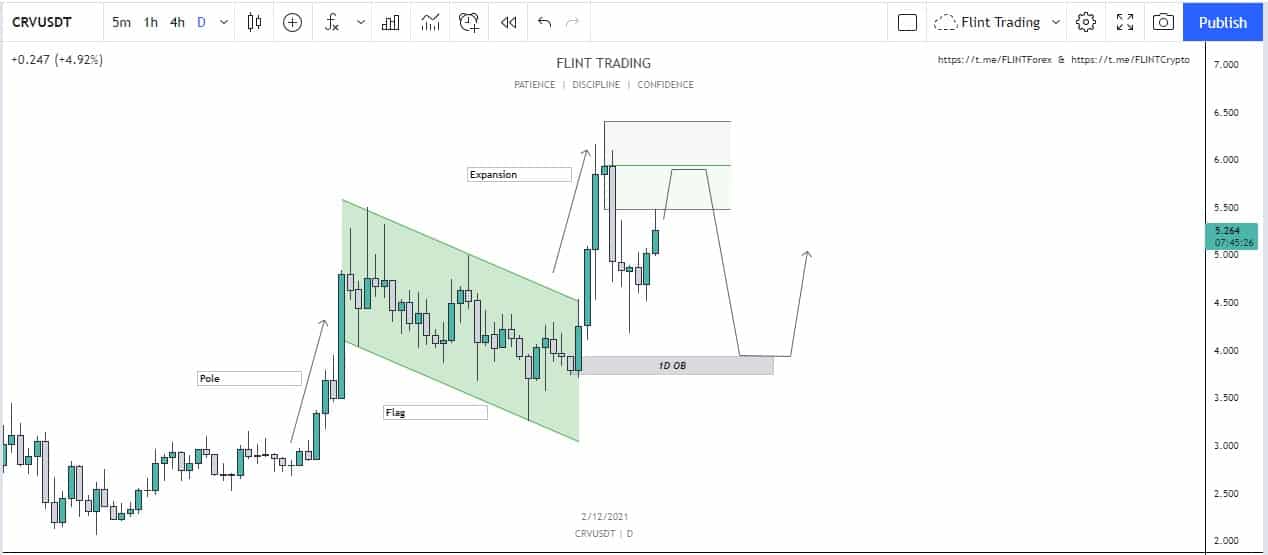
    A lot is happening on the daily chart of CRV. The first thing of interest is the formation of the pole flag pattern that the price is currently forming. It can be seen that the price had created a pole and then a flag. This has resulted in a drop in the price. After this, the price rallied up to create the second part of the structure and created an order block on the way.

    CRV - 1D

    Now the drop had occurred and the unmitigated areas might drive the price upwards from where it can face rejection. This rejection would ultimately cause the price to drop down to the order block which was formed and as a result would also complete the pole flag pattern.

    Invalidation in this scenario would be the price going upwards and becoming stable. This would result in the creation of a new higher high. Of course, lower time frame confirmations should be taken into consideration to have a cleaner entry into the market.

    Price Prediction – Curve Dao (CRV)

    According to wallet investors, CRV is a good investment but does not provide a great return. According to them, CRV is supposed to reach the value of $6.90 in a single year and in five years the price is expected to reach a value of $12.5. But people who trade are quite optimistic about the price and think that it would reach quite a high value.

  • Where is Polygon (Matic) Moving Now?

    Where is Polygon (Matic) Moving Now?

    At the time of writing MATIC is being traded at the price of $2.03. The price of MATIC has increased by almost 11.25% in the past 24 hours. The maximum and minimum of the day are around $2.03 and $1.76. The daily trading volume has also increased by almost 52.69% in one day. MATIC is listed on coinmarketcap at 17th spot according to market capital and has a market dominance of about 0.53%.

    MATIC before the crash had achieved its all-time high around the price of $2.70 in May 2021. During the crash, Matic created a bottom and dropped down to $0.621. As compared to other coins MATIC has been one of the fast gainers but it still hasn’t touched its ATH. But the way it is moving, it wouldn’t be long before it goes into price discovery.

    MATIC has a total supply of around 10B tokens and has a circulating supply of around 7.02B coins. It can be traded at a lot of different exchanges such as crypto.com, OKEx, Huobi with different trading pairs.

    Technical Analysis – Polygon (Matic)

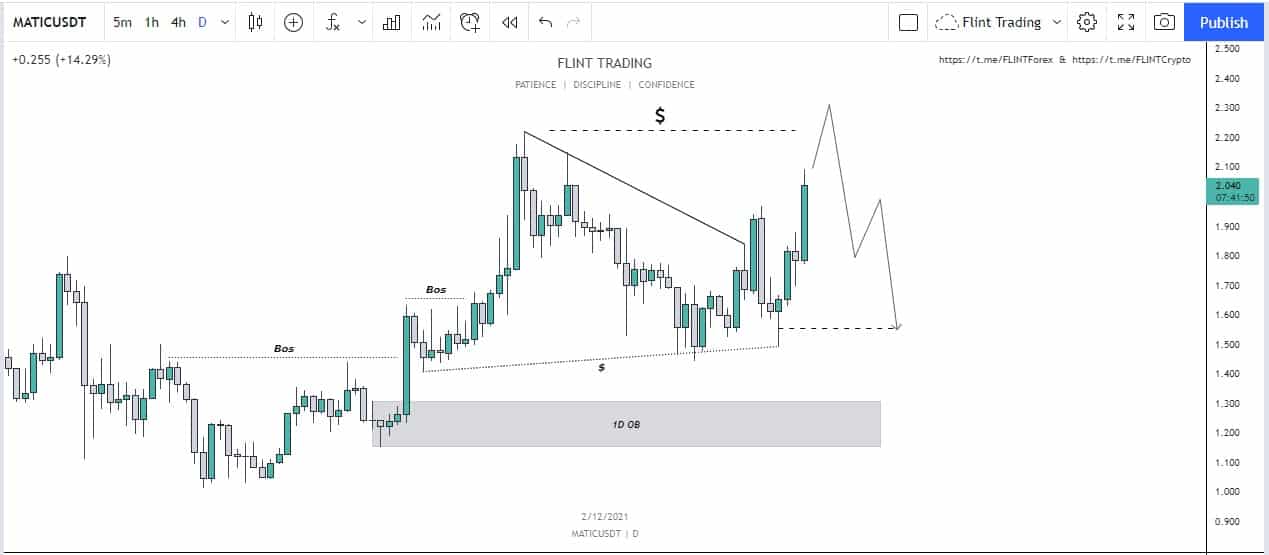
    Matic has been one of the most bullish charts in the market. On the daily time frame, we can see that the price was respecting a trend line which eventually resulted in a descending wedge being created. Once the price broke out of the structure, the price came down to retest the support level.

    Matic -1D

    It should be noticed that it was being supported and it had bounced from a trend line in the past. Now the price is moving with a huge momentum towards the upside. A target in mind is the grabbing of liquidity, which is present on the top side. Once it catches that, we can expect a reaction from the price.

    In case the price becomes stable we can expect it to go higher, but on the other hand, if it fails to hold the level, we can expect the price to drop down. The first level of interest is the price around $1.7 from where the price can bounce. The second level of interest is around $1.2.

    Price Prediction – Polygon

    Polygon (Matic) has been one of the highly bullish coins in the market. According to wallet investor, Matic in one year is expected to reach a value of $3.475. In five years, it is expected to touch $10.667.