Tag: Technical Analysis

  • Where is Loopring (LRC) moving to?

    Where is Loopring (LRC) moving to?

    At the time of writing LRC is being traded at the rate of $2.82 with a decrease of 2.54% within the last 24 hours.

    The low within this tenure was around $2.72 and the high was approximately $2.96. The coin as being in the watchlist of many traders makes it rank all the way up to number 51st according to the latest data released by coin market cap.

    LRC made its all-time high in the month of November 2021 where it reached an enormous amount of $3.85. At the moment it has a daily volume of $500,979,005 with an increase of 3.73% within the last 24 hours. The circulating supply of LRC is now around 1.33B. LRC has a dominance of 0.14.

    The top exchanges for trading LRC are currently Binance, Mandela, FTX, OKEx.

    Technical Analysis – Loopring (LRC)

    There isn’t much available on the daily time frame, so moving to the 4-hour time frame to notice more details. It can be seen that the price is consolidating. It should be noticed that the price is being supported by a trend line. At numerous positions, LRC has bounced back from there.

    The price had formed a head and shoulder pattern which has resulted in the drop in the price. Now, this drop created an imbalance in the position. This imbalance can drive the price upwards. Normally we see the price to mitigate the 50% of the imbalance candle and we expect it to happen.

    LRC - 4H

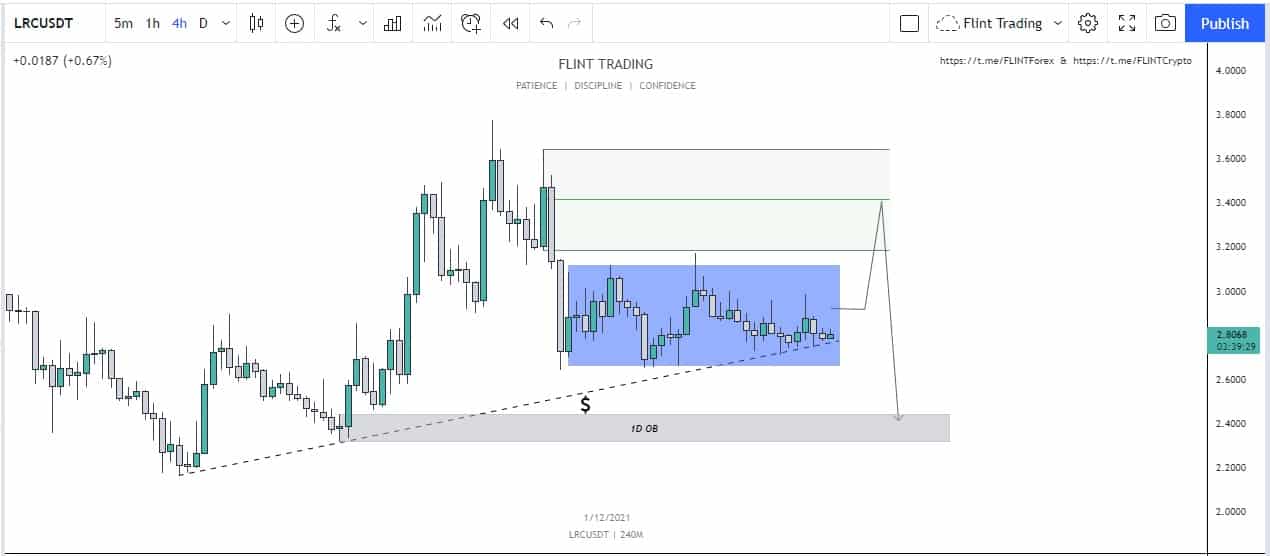
    The second zone to notice is the order block formed below. If the price isn’t able to hold above, we can expect LRC to drop down and touch the order block. Of course, it can reverse from other positions such as around $2.6. In case the price holds, we can expect a higher move upwards to create new highs.

    Price Prediction – Loopring (LRC)

    In the long run, LRC is a highly good opportunity. In September LRC was being traded at the price of around $0.4 and now it has crossed two dollars. According to the wallet investor, the price of LRC is to reach a value of $3.676 in a year. For a five-year plan, the price will reach a value of $6.369. The way the price of LRC has grown, the traders are even more bullish on the value and they think that it will reach even more.

  • Where is Algorand (ALGO) moving Now?

    Where is Algorand (ALGO) moving Now?

    At the time of writing this article, ALGO, the utility token of Algorand, has a value of $1.95 (7.54% increase today) with a trading volume of $741,396,537 with an increase of about 61.83% over the past 24 hours. It has been of the top gainers today among the top 100 cryptocurrencies.

    ALGO is listed on coinmarketcap in 21st place. It has a market dominance of about 0.46%. ALGO had created its all-time high around the price of $3.44 in June 2019.  It later dropped to the price of $0.06 in March 2020 from where it showed reversal. Since then, the coin has been on an upward trajectory but is still far from what its highest price was. It has a circulating supply of about 6.29B. It has a total supply of about 10B.

    Technical Analysis – Algorand (Algo)

    We can see that on the daily time frame, Algo was moving and respecting the trend line. The price broke down to create a fake-out which has eventually led to a highly impulsive move upwards.

    The price of Algo was quick to retrace back and started moving lower. On a smaller time frame, we can notice, how it was respecting the trend line after this as well but eventually broke out of it as well.

    Algo -1D

    A point of notice here is the daily order block that lies below, which started this whole move. The second point to notice is the wick which was long enough to grab the liquidity above. As the price is now starting to print the higher high. It can be expected of it to reach the middle of the wick and mitigate it. Once it happens, additional confirmations on the lower time should be taken into consideration about how the market may behave there.

    If the price becomes stable we can expect Algo to move higher, if it isn’t able to keep up, we can expect the price to drop down and touch the unmitigated daily order block.

    Price Prediction – Algorand (Algo)

    The coin also seems to have a good future. With the amount of potential, it has (since it still hasn’t been able to break its all-time high). It shows that it can go massive in the future. According to the wallet investor, it is expected to reach a value of $2.922 in a year. For five years, the price is expected to reach a value of $7.830.

  • Horizen (ZEN) – Where can the price Go Now?

    Horizen (ZEN) – Where can the price Go Now?

    At the time of writing this article, ZEN, the utility token of Horizen, has a value of $117.23 (9.27% increase today) with a trading volume of $125,581,40 with an increase of about 45.13% over the past 24 hours. It has been of the top gainers today among the top 100 cryptocurrencies.

    ZEN is listed on coinmarketcap in 89th place. It has a market dominance of about 0.05%. ZEN had created its all-time high around the price of $169.23. It later dropped to the price of $42 from where it showed reversal. The highest it went today is around $122. It has a circulating supply of about 11.79M. It has a total supply of about 21M.

    Technical Analysis – Horizen (ZEN)

    ZEN before the impulsive shot was moving in a channel. It can be seen that while moving in the channel, the price grabbed the liquidity with a fast wick upwards but soon closed inside the channel.

    After the price touched the bottom of the channel, the price shot upwards and eventually broke the channel. This result in the creation of a higher high in the market.

    ZEN - 1D

    After that, the price had a strong rejection from the top from where it broke down. It did eventually recover after bouncing from the line which was holding it in the first place. Even though the price is rising, the structure has broken down. Now we can expect the price to mitigate the middle of the candle which caused this move down. Now we can expect a possible reaction from this zone. Once it happens and we get the lower time frame conformations, we can expect the price to drop down to the position of the order block (which has been marked on the chart). Once the price reaches there (if) we can look for a possibility of along from there.

    Invalidation would be ZEN holding above the red candle and moving upwards to continue the bullish structure.

    Price Prediction – Horizen

    The coin also seems to have a good future. Digital Coin Price expects a value of $173.39 by the end of the year and positive growth throughout the next five years. In 2025, it is expected to be around $277.79. Wallet Investor is more liberal with its predictions which expects ZEN to have a value of $185.25 by the end of the year and $493.28 within 5 years.

  • Shiba Inu (SHIB) – What is the Chart Showing

    Shiba Inu (SHIB) – What is the Chart Showing

    The meme coin that took over the market after the Dogecoin (DOGE) is Shiba Inu (SHIB).

    Shiba Inu (SHIB) has been very bullish on higher time frames. Looking at the monthly time frames, SHIB seems to be in a bullish trend for the long term. SHIB created its all-time high at the price of $0.008854 during the month of October 2021, but the price couldn’t be sustained and soon after for the next three weeks the price dropped down to a value of $0.00003560.

    At the time of writing SHIB is being traded at the price of $0.00005146 with an increase of almost 31.73% in the past 24 hours. The trading volume has also increased by almost 444.03% today. It has a market dominance of about 1.07% and ranks in the 11th spot. It has a total supply of 589B coins and a circulating supply of 549B.

    Technical Analysis – Shiba Inu (SHIB)

    Shiba Inu (SHIB) has been printing green candles throughout the day. After the bounce from BTC, the price of SHIB has been continuously rising. Now the price has tapped into the daily order block. This was the point from where the SHIB had rejection before and started to fall down. The structure got broken down but it eventually reversed.

    It can be seen that the price went down to grab the liquidity which provided it with the necessary fuel to rally upwards. Now the structure has once again reversed.

    SHIB - 1D

    A possible movement now is the rejection of the price from the daily order block. This would result in a drop in the price. If the bullish structure is to be maintained, then it must stay above the structural shift position. From there we can look for a possible long depending on the lower time frame confirmations. If we get it then the price would rally upwards.

    Invalidation of this scenario would be SHIB stabilizing above the daily order block which would be the confluence of the price to move higher.

    Price Prediction – Shiba Inu

    Shiba Inu has been one of the most bullish coins in the market. According to the wallet investor, the price of SHIB can be expected to reach a value of $0.000089 in one year. In five years the price is expected to reach a value of $0.000289. But people are eying a much higher value of Shiba Inu (SHIB)

  • Siacoin (SC) – Where can the Price go now?

    Siacoin (SC) – Where can the Price go now?

    According to coinmarketcap, the maximum supply of the coin is around 49.44B SC and the circulating supply is around 49.44B SC. SC holds the 96th rank according to market cap and has the market dominance of 0.04%.

    At the time of writing, SC is being traded at the price of $0.024 with a drop of almost 4.25% in the last 24 hours. SC is a really strong token fundamentally. The maximum and minimum today are $0.02605 and $0.02345 respectively. The daily trading volume has also decreased by almost 39.39%. It had created its ATH in April 2021 and reached a price of almost $0.064. During the crash, the price of SC dropped down to a level of $0.00762. The price since then is trying to recover and it can be seen to rising steadily.

    Technical Analysis – Siacoin (SC)

    Siacoin (SIA) has been following the trend line and many times, the price has bounced from there. When the price broke out of this trend line, it also broke the structure as well. This led to the creation of a daily order block.

    It can be seen that in the past, the price had grabbed liquidity before. The recent move with the wick also did this and the candle eventually closed in the red.

    SC -1D

    Now the possible movement of the coin is that it would mitigate the lower order block. When it does, we can expect a possible bounce from there which can be taken as a possible entry to a long position.

    Invalidation of this scenario would be the price stabilizing above the structure from where a possible reaction can be expected.  So lower time frame confirmations should be taken into consideration before taking an entry.

    Long Term Investment – Siacoin

    In the long run, people are quite hopeful about the SC. They think that it is going to attract an even more audience that is going to make it even more mainstream.

    But according to wallet investor, in a four-year plan, it is supposed to drop down to a price of $1.933 which is quite less than the price that SC has right now. As opposed to the general mindset of the investors and retailers this is quite an opposite perspective and this calls for SC to be not a good investment. But people are hopeful that SC will achieve new heights in the near future.

  • GALA coin drops 8% today – What’s Next

    GALA coin drops 8% today – What’s Next

    At the time when this article is being written, the current value of GALA is $0.645 with a trading volume of a whopping $1,225,222,786. (this is a decrease of about 43.30% over the past twenty-four hours). After the launch of Meta, the whole metaverse market had been pumping hard and it seems like that they are having an independent movement as compared to Bitcoin. GALA in the past had pumped hard but now there is a decrease of about 7.82%.

    There are currently 6.98 Billion GALAs in supply with a total supply of 35,240,112,493. The 43rd ranked coin is bound to soar in the future as well with the release of the rest of its game in development and the zero-knowledge layer layout of Ethereum. It has a market dominance of about 0.17%.

    Technical Analysis – GALA

    Meta news proved to be highly bullish for the price of Metaverse coins. MANA, SAND has been one of the coins that eventually broke away from the BTC and we could see them moving with strong momentum even when the market was red.

    Now after many days of making higher highs, GALA has now slowed down. It can be seen that the price broke the structure and led to a higher price. Soo after, the move got slowed down and we saw the price dropdown.

    GALA - 1D

    Now the price has failed to maintain the higher structure, it failed to create a higher high, and now is going down. If it wants to keep the structure intact, the price must get over the last higher high and consolidate to provide us confluence about the market.

    It should be noticed that fundamentals overtake the technical. Being a part of Metaverse, pumping of other coins would eventually lead GALA to increase in price as well. This would also invalidate the scenario.

    Price Prediction

    Metaverse is the next grail and it’s going to make a lot of people rich. As such, coins like PYR, MANA, SAND, GALA is going to go big in the market. According to the wallet investor, the price of GALA is expected to reach a value of $0.987 in a year and in five years, the price is expected to reach a value of $2.210.

  • How Well could Ethereum (ETH) Perform

    How Well could Ethereum (ETH) Perform

    The second frontrunner of the whole crypto market. The second highest dominance in the market is Ethereum (ETH).

    At the time of writing, ETH is being traded at the price of $4,419. The price of ETH has increased by almost 7.08% in the past 24 hours. The daily trading volume has also increased by almost 40.28% in one day. ETH is listed on coinmarketcap at 2nd spot according to market capital and has a market dominance of about 20.05%.

    ETH before the crash had achieved it ATH around the price of $4,372 in May 2021. It later fell down to the price of $1700.48 during the crash and showed reversal from there. As compared to other coins it has been one of the fast gainers and now has achieved a new all-time high around the price of $4,868.

    Technical Analysis – Ethereum

    Ethereum (ETH) had continued to stay ahead of the major market and has printed new all-time high in the process. The price of the coin had been moving in a channel which can be clearly seen in the chart. But the price broke down and now has moved into an accumulation phase. 

    ETH - D

    Now with confluence to the movement of BTC, we can expect a similar movement as the king. It seems that the price would create an AMD pattern. The accumulation phase is currently being completed and we can soon expect the price to move to manipulation where we can expect the price to go near the previous all-time high. After that, the distribution or expansion phase can start which can drive the price down to the daily order block from where we can expect a possible reaction from the market.

    Long Term Prediction – Ethereum (ETH)

    According to wallet investors, the price of ETH is highly bullish in nature and is a safe investment, and will continue to lead the market. According to their predictions, the coin will reach a value of $7,311 in one year. For a five-year plan, ETH is expected to reach a value of $19,232.

  • Where the King is Moving? – Bitcoin (BTC)

    Where the King is Moving? – Bitcoin (BTC)

    At the time of writing, BTC is being traded at the price of $57,980. The price of BTC has increased by almost 5.52% in the past 24 hours. The daily trading volume has also increased by almost 32.36% in one day. BTC is listed on coinmarketcap at 1st spot according to market capital (the one true king of the market) and has a market dominance of about 42.03%.

    BTC before the crash had achieved its all-time high around the price of $64,895 in April 2021. During the crash, the price of BTC touched a bottom of $28,600 during the month of June 2021. After this, the price showed reversal and went to achieve a new all-time high around the price of $69,000.

    BTC has a total supply of 21M coins and has a circulating supply of about 18.8M tokens. BTC can be traded at a lot of different exchanges such as Binance, OKEx, Huobi with different trading pairs.

    Technical Analysis – Bitcoin

    Before the drop of Bitcoin (BTC) from all-time high, people were expecting it to crack the 70k, but the number was a strong zone to crack and quickly resulted in the fall of the market. Now the market is trading in the $50s and we can expect it to drop even more to the $40s.

    BTC - 1D

    It can be seen that the market has been bouncing from $53k support. In the past, it had stayed there for a while before moving to the all-time high. We can expect the market to touch the $63k zone before it falls down to the 40s as a move of fake-out. But this is only one possibility and a lot more can change in a matter of minutes. So lower time frame confirmations are important. Possible zones to watch out for are $49k, $53k, $58k, $62k.

    Long Term Price Prediction – Bitcoin (BTC)

    Before the drop of BTC from $69k. People were expecting the price of BTC to touch the value of $100k before the end of the year. Now after the drop-down to $52k, a lot of those speculations have vanished. A lot of people are still eying for BTC to break the all-time high and touch the zone of $80k but it seems that it has become difficult right now with the way price has been reacting

  • Oasis Network (ROSE) – Where to Now?

    Oasis Network (ROSE) – Where to Now?

    ROSE being ranked at number 91st according to coinmarketcap data is being traded at around $0.395 at the moment. The coin has a decrease of almost 2.97% within the last 24 hours. The high within this the price reached was $0.443 and the low was marked at $0.3659.

    The coin has a trading volume of around $347,543,892 with a decrease of almost 26.41% in the last 24hours. The Circulating supply is now equal to 3.49B ROSE

    ROSE reached its all-time high this month on 21st November 2021. The price reached a value of $0.466. This month has been highly bullish for the coin and we have seen an increase of about 115%. The top exchanges for trading in ROSE are currently Binance, Mandala Exchange, KuCoin, gate.io, and coin tiger.

    Technical Analysis – Oasis Network (ROSE)

    ROSE was consolidating for a lot of time and then created an impulsive move that broke the structure. The market created equal highs which was the signal for the price to drop. Soon after the price reached the second equal high from where ROSE printed a bearish candle which dropped the price.

    This move resulted in the drop of the price to the daily order block which grabbed all the liquidity and the price moved upwards. It can be seen that the price goes through an AMD pattern but here the distribution occurred directly.

    ROSE - 1D

    Now the price has started to consolidate on the daily time frame. The presence of imbalance, daily order blocks is a confluence for the price to drop. There are two possible points which should be taken into consideration. The daily order block which lies just below which may be a point for the market to reverse. The second point of reversal is the equilibrium zone before the upward movement. If it reverses from around $0.30 then a possible long can be taken, so lower time frame confirmations should be taken into consideration to take entries.

    Price Prediction –  Oasis Network (ROSE)

    Oasis Network has very positive expectations from the price. According to the wallet investor, the price is expected to reach a value of $0.523 in a year. In 5 years, the price is expected to reach a level of $1.087. With the number of new partnerships, it can be expected that ROSE is going to be worth a lot more in the future.

  • Avalanche (AVAX) – On its way to lose the Three Digits?

    Avalanche (AVAX) – On its way to lose the Three Digits?

    The native token of Avalanche Ecosystem is AVAX

    At the time of writing AVAX is being traded at the rate of $123.47 with an increase of 4.11% within the last 24 hours.

    The low within this tenure was around $113 and the high was approximately $127. The coin as being in the watchlist of many traders makes it rank all the way up to number 11th according to the latest data released by coin market cap.

    AVAX made its all-time high in the month of November 2021 where it reached an enormous amount of $147. At the moment it has a daily volume of $2,264,814,846 with an increase of 22.37% within the last 24 hours. The circulating supply of AVAX is now around 223M. AVAX has a dominance of 1.06.

    The top exchanges for trading AVAX are currently Binance, Coinbase, Huobi Global, Bitfinex, Gate.io, Kucoin, and more.

    Technical Analysis –  Avalanche (AVAX)

    AVAX has been one of the most bullish coins. The price has been printing parabolic movements towards the top which eventually led the price to cross the three-digit mark. Now if we see the weekly time frame, we can see that the price had a rejection from that point. On a slightly lower time frame, it is also seen that the price has shifted the structure.

    There are a few confluences about how the price can react from here. The presence of the imbalance and the order block can drive the price down. Moreover, if a Fibo is drawn we can see that the 0.168 point coincides with the order block as well.

    Avalanche (AVAX) - 1D

    Now the first point to notice is the middle of last week’s candle. Due to the presence of imbalance, the price may reverse from there. In such a case, a good way is to DCA if the price continues to a dropdown. But overall the price is bullish in nature.

    Price Prediction – Avalanche (AVAX)

    In the long run, AVAX is a highly good opportunity. In September AVAX was being traded at the price of around $50 and now it has crossed the three-digit mark. According to the wallet investor, the price of AVAX is to reach a value of $251.081 in a year. For a five-year plan, the price will reach a value of $724.457. But the investors are even more bullish on the value and they think that it will reach even more.